Both of these studies quite successfully applied timing systems to a single index only. In practice however, the real power of trend following systems is their ability to identify and ride many trends simultaneously. If U.S. stock markets are choppy, perhaps there is a nice trend underway in oil, Treasuries or international small-cap stocks. If so, the trend following system will find them and ride them to generate returns.
The arch enemies of trend following systems are flat sideways markets, as well as extended markets with big, fast reversals in direction. Sailors will understand this implicitly, as a sailor's greatest enemy is low winds, followed closely by blustery winds which constantly change direction. So long as there is a fairly constant breeze blowing in the same general direction, a sailor can set his sails and ride, with only minor regular adjustments. When the winds change direction, the sailor adjusts. Similarly, so long as markets spend a few months going in the same general direction, trend-following systems will ride along and capture profits. When they spend a few months moving in the opposite direction, or no general direction, trend followers will "tack" or "lower their sails" respectively as the market requires.
With this study we have set out to confound our trend following system by testing it against 3 of the most difficult market periods of the past 140 years:
- The Nasdaq tech bubble and subsequent crash
- The Nikkei property bubble and subsequent crash
- The 'Roaring 20s' stock market bubble and subsequent Great Depression
It is important to note that, even during these periods, it was possible to find assets somewhere which were trending. For example, during the Great Depression, gold prices moved substantially higher over many years. During the Nikkei's long plunge from 1990 through 2000, U.S. stocks experienced one of their most intense bull markets. For this reason, a thoughtfully conceived asset class rotational system rarely encounters periods where no trends are to be found anywhere. Further, where such a period has occurred, such as during the years 2000 - 2002, it didn't last long, and losses were very well contained.
NASDAQ
The period from early 2000 through late 2002 saw U.S. markets peak following one of the richest parabolic runs in market history: the tech bubble. The collapse that followed in the Nasdaq stock market lasted almost 2 years, and took the index down 75% from its highest monthly close in April 2000. After bottoming in 2002, the market gained over 100% through late 2007 before experiencing a second collapse in 2008 which cut the value of the index in half. The market then experienced a very steep rally, which we are still enjoying today.
Chart 1. Nasdaq Composite 1998 - 2010
 Source: Wikiposit.com, Butler|Philbrick & Associates
Japanese Stocks
The Nasdaq peak and collapse looks similar to the parabolic peak and collapse in the Japanese stock market which occurred in the late 1980s and throughout the 1990s. Chart 2. below closely aligns the Nikkei's final surge from 1988 through 1990, and its subsequent collapse through the year 2000, with the Nasdaq's peak and collapse. Note how closely the trajectory of the Nasdaq tracked the Nikkei's waterfall - the price series are not exactly the same, but they certainly 'rhyme'.
Note that the Nikkei return series was transformed to match dates with the Nasdaq series above, so the dates on Charts 2. and 3. are not accurate for these markets.
Chart 2. Nikkei Japanese stock market composite 1988 - 2000


You can see that diversification works - sort of. While the combined portfolio didn't gain in value over the period, neither did it lose any, with annualized returns of 0.06% per year. The portfolio did gain almost 60% in the first couple of years, and then lost over 50% from its peak value (see Max Total Equity DD in Chart 4.), but it ended up right back where it started by the end. This is much better than it would have done by holding the Depression market or the Nikkei alone.
Market Timing and Rotation
As with our other studies, we will apply three simple strategies to this basket of 3 investments which have the potential to substantially improve returns, and with much less risk of loss.
Moving Average Timing System
The first approach involves a simple moving average timing system. In this case, we own an equal amount of each index, rebalanced annually. However, if any of the 3 indices closes any month below its 10-month moving average, the system will sell that index and hold cash instead (at the U.S. dollar rates prevailing during the Nasdaq's run and collapse around the turn of the century). When an index closes back above its 10-month moving average, the system will re-purchase the index at the then prevailing price.
A simple moving average system improves risk-adjusted performance dramatically. With this system, we are able to achieve substantial positive returns over the period of 5.4% per year, which compares with returns of ~0% per year for the 'Buy and Hold' example. At the same time, risk is reduced by 50%, with the worst total peak-to-trough loss over the period of just 24%, versus 56% for the 'Buy and Hold' approach.
Chart 5. 3 Grizzlies with 10-Month Moving Average Timing System


Conclusion
We endeavored to test some simple timing systems under very extreme conditions to see how they held up. It is important to test how systems behave under a variety of market conditions so that we can be as certain as possible that our systems will work no matter what the market holds in the future.
We chose the three most volatile, deepest bear markets of the past 140 years for our test case. While we can't be certain that these markets represent the most challenging conditions possible under which our systems might be forced to operate, we can say that these are some of the most challenging conditions investors have faced in history. While future markets will throw new and unexpected challenges at us, studies like this help to demonstrate how simple systems can adapt to almost any market environment to deliver more consistent and robust returns than 'Buy and Hold', and with substantially less risk.
The 3 Grizzlies
NASDAQ
The period from early 2000 through late 2002 saw U.S. markets peak following one of the richest parabolic runs in market history: the tech bubble. The collapse that followed in the Nasdaq stock market lasted almost 2 years, and took the index down 75% from its highest monthly close in April 2000. After bottoming in 2002, the market gained over 100% through late 2007 before experiencing a second collapse in 2008 which cut the value of the index in half. The market then experienced a very steep rally, which we are still enjoying today.
Chart 1. Nasdaq Composite 1998 - 2010

Japanese Stocks
The Nasdaq peak and collapse looks similar to the parabolic peak and collapse in the Japanese stock market which occurred in the late 1980s and throughout the 1990s. Chart 2. below closely aligns the Nikkei's final surge from 1988 through 1990, and its subsequent collapse through the year 2000, with the Nasdaq's peak and collapse. Note how closely the trajectory of the Nasdaq tracked the Nikkei's waterfall - the price series are not exactly the same, but they certainly 'rhyme'.
Note that the Nikkei return series was transformed to match dates with the Nasdaq series above, so the dates on Charts 2. and 3. are not accurate for these markets.
Chart 2. Nikkei Japanese stock market composite 1988 - 2000

Source: Reuters, Butler|Philbrick & Associates
The U.S. Great Depression
Last, but certainly not least, we tested against the granddaddy of all challenging markets - the 'Roaring Twenties' bull market and the ensuing Great Depression. In order to overlay this longer bear market with the Nasdaq and the Nikkei, we shortened the testing period to include just the very tail end of the market rally in 1929, and all of the ensuing Depression through 1942. You will note that this period resembles the other two 'Grizzly' bear markets, but only modestly.
During the Depression, stocks dropped almost 90% from peak to trough, though the maximum loss from the highest month-end close to the lowest month-end close was about 82%. The return series charted below captures total returns including dividends over this period (again, using the dates of the Nasdaq collapse for testing purposes). Interestingly, the Nikkei and U.S. stocks over the Depression years delivered the same annualized return: ~ negative 3.3% per year for 12 years (see CAGR% in charts 2. and 3.)
Chart 3. U.S. stock market during the Great Depression 1929 - 1942

Source: Shiller (2011), Butler|Philbrick & Associates
Buy and Hold with Rebalancing
These were clearly very challenging periods for investors, and God forbid that we ever experience a period where all markets behave this way at the same time. However, given the strange powers at work in markets today, and the amount of aggregate leverage (debt) in the system, we can't entirely rule out this possibility during our investment horizon. So how would an investor fare in an environment where all investable markets were to collapse at once? This study provides a proxy for just this situation.
A typical investor who believed in traditional risk management via diversification might have an equal amount invested in all three markets, and might rebalance between the markets every year to maintain his 'Strategic Asset Allocation'. While most investors might have some bonds as well, we could envision an aggressive investor with equal exposures to, for example, North American, European and Emerging Market stocks, where all markets collapsed en masses as in 2008.
Chart 4. assumes an investor chooses to allocate equally to all 3 of the markets above for the entire period shown, and that he rebalances his portfolio at the end of every year.
Chart 4. Buy and Hold with Rebalancing

Source: Shiller, Reuters, WikiPosit.com, Butler|Philbrick & Associates
Market Timing and Rotation
As with our other studies, we will apply three simple strategies to this basket of 3 investments which have the potential to substantially improve returns, and with much less risk of loss.
Moving Average Timing System
The first approach involves a simple moving average timing system. In this case, we own an equal amount of each index, rebalanced annually. However, if any of the 3 indices closes any month below its 10-month moving average, the system will sell that index and hold cash instead (at the U.S. dollar rates prevailing during the Nasdaq's run and collapse around the turn of the century). When an index closes back above its 10-month moving average, the system will re-purchase the index at the then prevailing price.
A simple moving average system improves risk-adjusted performance dramatically. With this system, we are able to achieve substantial positive returns over the period of 5.4% per year, which compares with returns of ~0% per year for the 'Buy and Hold' example. At the same time, risk is reduced by 50%, with the worst total peak-to-trough loss over the period of just 24%, versus 56% for the 'Buy and Hold' approach.
Chart 5. 3 Grizzlies with 10-Month Moving Average Timing System

Source: Source: Shiller (2011), Reuters, WikiPosit.com, Butler|Philbrick & Associates
Rotational Timing System with Cash Alternative
For a second cut, we applied our relative strength rotational strategy to signal when to hold cash, and when it makes sense to hold each stock index. Conceptually, this approach makes use of a simple momentum system where we own a stock index when it has outperformed cash over the prior year or so, and we hold cash otherwise. This decision is applied for each index independently, and capital is rebalanced at the end of every year.
In this way, stocks earn their way into the portfolio by demonstrating positive returns over any prior 6- to 12-month period. If they haven't earned their place in the portfolio by exhibiting strong prior returns, then statistically it makes better sense to hold cash.
We can see that by applying this technique against the three indices we were able to extract returns of over 8% per year, even while each of these markets independently peaked and crashed over a period of many years. Risk is further reduced as well: investors using this system only had to endure a 2 year period of modest losses, with a maximum peak-to-trough drop of less than 20%.
Chart 6. Grizzlies with Relative Strength Rotational System with Cash Alternative
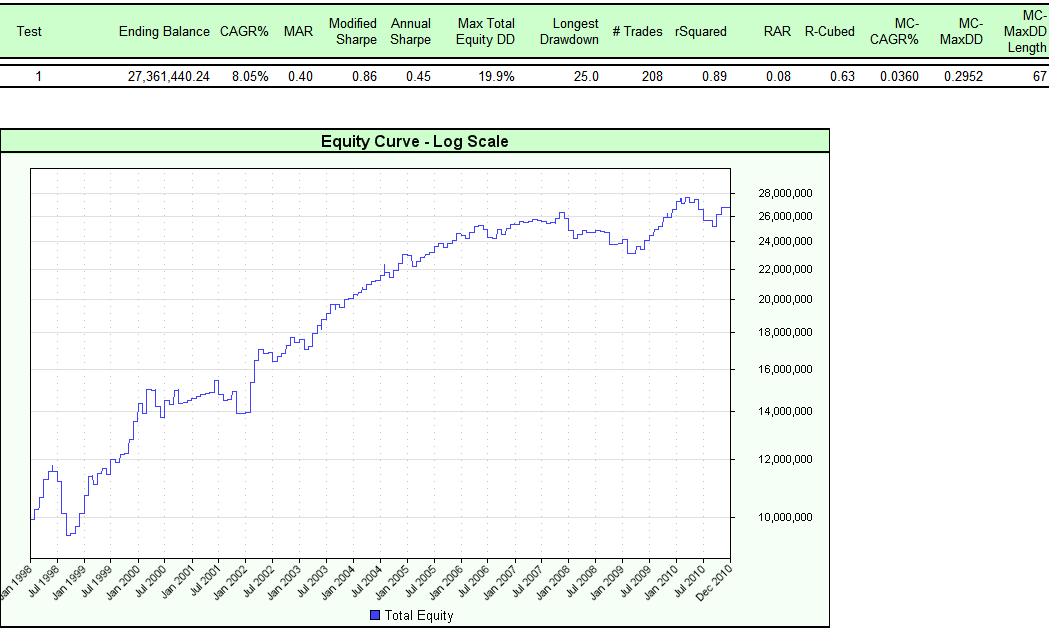
Source: Source: Shiller (2011), Reuters, WikiPosit.com, Butler|Philbrick & Associates
Rotational Long/Short - The Goldilocks System
The 3 Grizzly Bears were periods where market prices dropped substantially over many years. Yet the above systems were only able to take advantage of periods where these markets went up; when markets were dropping, they sat in cash. It follows logically that if we were to allow a system to also take advantage of periods where markets were dropping, by selling short, that we might be able to extract even higher returns, especially against markets that are experiencing long declines.
Our rotational long/short system applies the same momentum ranking system as the rotational timing system described directly above. However, instead of moving to cash when index returns have been weak, our long/short system sells the index short in order to capture gains while the market is going down.
Amazingly, while the 3 Grizzlies are raging and tearing a big hole in most investors' portfolios, Goldilocks is able to coax the 3 bears into delivering returns of almost 13% per year! The risk in the system is only slightly higher than the risk to the rotational system with cash, with a maximum peak-to-trough loss of 24% versus 20%, and an investor is never below water on his investments for much longer than 2 years.
Chart 7. Goldilocks and the 3 Grizzlies

Source: Shiller (2011), Reuters, Butler|Philbrick & Associates
Conclusion
We endeavored to test some simple timing systems under very extreme conditions to see how they held up. It is important to test how systems behave under a variety of market conditions so that we can be as certain as possible that our systems will work no matter what the market holds in the future.
We chose the three most volatile, deepest bear markets of the past 140 years for our test case. While we can't be certain that these markets represent the most challenging conditions possible under which our systems might be forced to operate, we can say that these are some of the most challenging conditions investors have faced in history. While future markets will throw new and unexpected challenges at us, studies like this help to demonstrate how simple systems can adapt to almost any market environment to deliver more consistent and robust returns than 'Buy and Hold', and with substantially less risk.