Monday, March 15, 2010

Smash that Crystal Ball

It's that time of year again.

Yep, the time of year when the major Bay Street and Wall Street firms, along with the major mutual fund companies, parade their gaggle of economists and strategists in front of every camera, microphone and scribbling print journalist in order to emboss their firm's logo on the impressionable minds of investors.

Eventually, the thinking goes, your current manager will have a poor year, or a poor twenty years, and you will inevitably start thinking about moving your hard-earned capital to another, more prospective wealth management group. If their firm has caught your attention over the years more often than other firms, the thinking goes, you are more likely to seek them out than their competition. 

This is one of the more common ways in which firms compete for your business.

They know from experience that you won't remember what their so-called 'expert' proclaimed on the news last year, or last month, about the shape of things to come. They know if doesn't matter what they say so much as the fact that they are out there, in the media, saying something.

But there is another, more insidious reason why each major firm has a variety of experts on staff loudly proclaiming their views year after year. The reason is simple: banks, mutual fund companies and investment firms make no money while clients are sitting in cash. Each time the investing public observes an expert loudly proclaiming that gold is going up, or interest rates are going up, or banks are going up, a few of them take heed, call their Advisor or consultant, and make changes to their portfolio. And each time they make a change, the Advisor, investment firm, or mutual fund company makes money.

Unfortunately, on average the investing public doesn't. In fact, by acting on this silliness, the average investor earned 4% per year less than the stock market from 1991 -2011.

Actual results to mutual fund investors vs. stock and bond benchmarks - 1991 to 2011
Source: Dalbar

That's why, at this time of year it is especially important to remind yourself about the abysmal track record these 'experts' have had over the years.

But before presenting the ugly details, I want to emphasize that investors should not feel disheartened by the evidence that financial marketing and media is dominated by loud, overconfident shills and mountebanks. On the contrary, investors should feel liberated to pursue other interests rather than reading or watching business news. For those that enjoy the cognitive 'sport' of investing from the standpoint of strategy and game theory, feel free to explore the latest economic, financial, ideological or philosophical fads with your colleagues and friends as provocative dinner conversation. This type of thinking keeps the mind young, after all.

Just don't orient your portfolio on the basis of your conclusions, or the conclusions of other prognosticators. We are all bound to be wrong far more often than we are right. For that is the nature of complex, dynamic systems like the markets.

The Truly Dismal Science

Now, here is the evidence. The following charts show aggregate forecasts from Wall Street's most famous oracles through time, next to the actual trajectory of the forecast variable. Note that these charts are sourced from James Montier's book Behavioural Investing (2007):

Chart 1. Consensus bond yields forecasts 1 year out vs. actual

Chart 2. Consensus S&P500 level 1 year forecasts vs. actual

Chart 3. Consensus S&P500 aggregate earnings 1 year forecasts vs. actual

In all cases the analysts appear to do a noteworthy job of describing what just happened, but appear to have no vision whatsoever about what is about to happen next. This applies to interest rates, the level of stock indices, and aggregate earnings.

Source: Despair.com

Do any experts get it right? What about the experts at the Federal Reserve who are in charge of setting interest rates? Can they predict the magnitude or direction of interest rates over the next six months?

A working paper entitled "History of the Forecasters: An Assessment of the Semi-Annual U.S. Treasury Bond Yield Forecast Survey" (Brooks & Gray, 2003) studied the ability of Federal Reserve economists, including Alan Greenspan, from 1982 - 2002 to discover whether the group of experts that sets interest rates is able to effectively forecast their trajectory through time. 

Chart 3.
Source: (Brooks & Gray, 2003)

Again we see a strong talent for describing what has just happened, but no talent whatsoever for predicting what will happen next. Just how poor was the forecasting ability of Fed economists, including sitting Fed Chairmen like Alan Greenspan, over the 20 year survey?

Chart 4. 
Source: (Brooks & Gray, 2003)

The scatter plot above shows how Fed forecasts of interest rates six months out are negatively correlated with actual outcomes. The r-squared of the regression is 0.07, which is not statistically significant, but if you were a betting man, your best bet would be in the opposite direction of what is forecast to happen by the people who actually set interest rates for the economy.

Overconfidence - of course

The error rate would not be so worrisome if it weren't for the high level of confidence that investment professionals imbue on their predictions. This effect is perhaps best illustrated using the results of a study by Torngern and Montgomery (2004). The study set laypeople (psychology undergraduates, the perennial guinea pigs) against investment professionals in a competition to select the stock that they thought would outperform over the next month from pairs of stocks. All the stocks were well known companies, but participants were given information such as the industry and prior 12-month performance for each stock as well. Participants were asked to choose the best performer from the pair, and to provide their level of confidence in their choice.

Over many picks, one might hope that when participants were 50% confident that their choice was right, they were accurate about half the time, and when they were 90% confident, they were right almost all the time. In fact, as you can see from the chart below, a person's confidence level was largely irrelevant to their accuracy over time. In other words, having greater confidence in a choice did not lead to higher accuracy levels. In fact, at extreme levels of confidence (>80%), professionals were actually less likely to get it right. At a 90% level of confidence, professional investors actually got it right only 15% of the time, while at a 55% - 75% level of confidence they achieved about 40% accuracy.

Chart 6: Accuracy and confidence on a stock selection task
Source: Torngren and Montgomery (2004)

It is important to remember that over a 1-month time horizon the results of these stock choices are almost random, so we are not out to skewer professionals on the basis of their accuracy in this test. Instead, we are left to wonder why anyone should have expressed such high levels of confidence in their choices. When asked this question, the layperson group admitted that they were mostly guessing, but also placed some emphasis on the previous month's returns (ahh, momentum at work). In contrast, almost no professionals admitted to guessing; instead, they attributed their choices to 'Other knowledge' about the stocks, and 'Intuition'. Incidentally, the only factor with any predictive power in this example, however small, is the previous month's results (momentum).

Chart 7. Average rating of decision input importance
Source: Torngren and Montgomery (2004)

So Now What?

The quantum leap in thinking that we strive to compel with this post is toward an understanding that the world is too complex to enable accurate forecasting. Axiomatically, people should consider expert forecasts as no more than entertaining narratives - brain candy to stimulate the imagination. 

The best we can hope for is an assessment that an existing dynamic or trend is likely to stay on a certain course, or alternatively that the dynamic is reverting to the mean. Forecasting the direction or the magnitude of the change in trend is empirically impossible.

Fortunately, statistics offers a useful toolkit for evaluating the probability of trend continuation or mean reversion, and offers an estimate about the magnitude of the change. Further, statistical models tell us how confident we should be in our estimates given the amount of data we have at our disposal, and the type of problem we are trying to solve.

Quantitative systematic approaches to investing explicitly leverage the power of statistics to make a large number of bets with better than even odds of success. Quantitative risk management techniques and optimizations can further stabilize results by minimizing the impact of being wrong, which in markets will happen a lot. 

Quantitative approaches are no silver bullet - they suffer periods of poor performance too. But they are explicitly built to take advantage of the law of large numbers, and to stay out of trouble when statistical forecast accuracy is poor.

For more information about quantitative approaches, please read the following articles.

http://gestaltu.blogspot.com/2012/08/if-you-could-manage-portfolio.html

http://gestaltu.blogspot.com/2012/05/intuition-is-for-suckers.html

http://gestaltu.blogspot.com/2012/05/despite-thousands-of-mutual-funds-and.html

http://gestaltu.blogspot.com/2012/05/volatility-analysis-for-lower-risk-and.html

http://gestaltu.blogspot.com/2012/03/another-expert-bites-dust.html


Friday, March 12, 2010

Mythbusters: Investor Edition

Myth # 2: You Will Get Rich by Heeding the Forecasts of Experts

Among all forms of mistake, prophecy is the most gratuitous. – GEORGE ELIOT

We have spent a great deal of time offering evidence that we are poor forecasters of the future. Disturbingly, it turns out that experts are no more prescient than the rest of us, even in their area of primary expertise. This post will describe the results of the most comprehensive and compelling study of expert fallibility to date, and offer lessons from the study that we can use to make better use (or not!) of expert opinions in future decisions.

Of course, we – the consumers of expert pronouncements – will continue to be in thrall to experts for the same reasons that our ancestors submitted to shamans and oracles: our uncontrollable need to believe in a controllable world and our flawed understanding of the laws of chance. We generally lack the willpower and good sense to resist the snake oil products on offer. Who wants to believe that, on the big questions, we could do as well tossing a coin as by consulting accredited experts.

Philip Tetlock spent over 20 years asking some of the top experts in their fields to make predictions about the future. The idea for the experiment took shape in the two or three year period prior to 1984 during the early years of the Reagan administration. Many of you will recall that this was a time of great anxiety and tension as the Soviets and the Americans seemed to move closer to nuclear Armageddon each day. Tetlock served on a committee charged with observing and forming opinions on American/Soviet relations. At that time in late 1983 the Bulletin of Nuclear Scientists had moved their Doomsday clock closer to midnight than at any other time since the Cuban Missile Crisis. It was widely believed by liberals that Reagan was leading the country on the road to nuclear apocalypse. Conservatives meanwhile believed that the best realistic outcome was for it to adopt a neo-Stalinist mode and retreat. Generally, the dominant view on both sides of the political aisle was that nothing good was going to happen.

While on this committee, which consisted of many well known political and military strategists at the time, it was widely noted that Gorbachev was rising through the political ranks in the Kremlin. Tetlock observed that no one at the time, however, believed that Gorbachev was likely to assume a leadership role in the Politboro. Further, it was commonly held that Gorbachev was secretly a neo-Stalinist in disguise. No one of any credibility thought that Gorbachev would execute a liberal revolution which would lead to the dissolution of the Soviet Union, and eventually the collapse of the Berlin wall and the reunification of Germany.

Of course, that’s just what Gorbachev went on to do. Interestingly, once Gorbachev had executed his coup, strategists of all stripes were eager to claim credit for having predicted just this outcome. Tetlock knew that in fact no one had predicted this outcome. This convinced Tetlock that there really would be great value if someone tried systematically to keep score on political experts. And that is just what he proceeded to do. From 1984 through 2001 Tetlock solicited frequent predictions from 284 experts in international affairs, economics, political strategy, and other complex fields. The experts consisted of a mixture of academics, journalists, intelligence analysts and people in various think-tanks, with an average of roughly 12 years of work experience each. No political view was over or underrepresented. Each expert made approximately 100 predictions, resulting in about 28,000 predictions in total. This allowed Tetlock to put the law of large numbers to good use. Experts were asked to make predictions on such topics as economic growth, inflation, unemployment, policy priorities, defense spending, leadership changes, border conflicts, entry-exit from international agreements, etc.

The results from the study are broad reaching and complex. Generally the results support the view that it is the way one thinks, not the depth of knowledge about a certain topic or theory, which matters most in tests of complex prediction. Tetlock expounds on the spectrum of thinking process bounded by foxes at one end of the spectrum and hedgehogs on the other, but this distinction is beyond the scope of this essay. We are more interested specifically in how well experts delivered accurate predictions over time, especially as it relates to experts’ confidence in their own predictions.
 
Here is a summary of the important lessons from the study:
  1. Experts are no better at predicting the future than the rest of us. In fact they are less accurate than a large group of dart-throwing monkeys
  2. Experts (like everyone else) are unlikely to admit when they are wrong, or to revise their beliefs in the face of conflicting evidence
  3. Those who know a lot about a subject are more likely to predict extreme outcomes (which rarely happen), and are more overconfident in their forecasts
  4. Specialists are no more reliable than non-specialists in forecasting outcomes in their own domain of study
  5. Experts who hedge their views, are self critical and consider alternative outcomes are more likely to be right
  6. Those experts who are better known and more frequently quoted are less likely to be right. Frightfully, these experts also make entertaining media guests
  7. Experts are no better at forecasting than basic trend-following systems such as ‘no change’ or ‘continue with the same rate of change’
  8. Of the 284 experts who offered predictions over 18 years, not one expert demonstrated a superior forecasting ability
In a review of Tetlock’s book, Louise Menand at The New Yorker magazine tells how Tetlock witnessed a shocking experiment during his student days at Yale. According to Tetlock,
“A rat was placed in a T-shaped maze. Food was placed in either the right or the left transept of the T in a random sequence such that, over the long run, the food was on the left sixty per cent of the time and on the right forty per cent. Neither the students nor (needless to say) the rat was told these frequencies. The students were asked to predict on which side of the T the food would appear each time. The rat eventually figured out that the food was on the left side more often than the right, and it therefore nearly always went to the left, scoring roughly sixty per cent—D, but a passing grade. The students looked for patterns of left-right placement, and ended up scoring only fifty-two per cent, an F. The rat, having no reputation to begin with, was not embarrassed about being wrong two out of every five tries. But Yale students, who do have reputations, searched for a hidden order in the sequence. They couldn’t deal with forty-per-cent error, so they ended up with almost fifty-per-cent error.”
Amos Tversky, the eminent behavioral economist, was fond of saying that human beings can only distinguish between three probabilistic outcomes: something is sure to happen; something is sure not to happen; and maybe. Quantitative economists and other forecasters can likely distinguish probabilities at a much higher level of granularity, but the experts that subscribe to these models are likely susceptible to the same overconfidence, and are thus not particularly reliable. The reality is that we live in a probabilistic world, not a deterministic one. On this basis, a decision making style that is predicated on adaptation rather than forecasting makes the most sense. Endeavour to not mistake a compelling narrative about future events with a strong likelihood of accuracy. In fact, one would do well to ignore loud exponents of fancy theories altogther, especially where those theories are used to make confident forecasts. By making many smaller bets with less confidence rather than few large bets with great confidence, you are likely to meet with greater success over time. 

For more information on Tetlock’s study and his results, I urge you to watch a presentation of his results at this link: http://fora.tv/2007/01/26/Why_Foxes_Are_Better_Forecasters_Than_Hedgehogs#fullprogram

Also, the full New Yorker article is worth reading. You will find it at http://www.newyorker.com/archive/2005/12/05/051205crbo_books1?currentPage=2

Purchase Philip Tetlock’s book at Amazon.

Tuesday, January 26, 2010

Mythbusters: Investor Edition

Myth #1: It Is Not Possible to Time the Market
It is a common refrain from mutual fund and investment management marketing material that investors should assume that it is impossible to time the market. In reality, with a fairly simple toolbox small investors can take steps to largely avoid major bear markets while enjoying the bulk of large, multi-year bull markets.
One might wonder, if this is possible, why everyone does not follow such a system. There is a different answer to this question for each major type of investor.
Large investors like pension funds, mutual funds and institutional portfolio managers can not react quickly enough to take advantage of the signals. It takes several weeks, often months, for very large investors to enter and exit stock and bond positions. A rapid exit would have a dramatic effect on the stocks being purchased or sold, and in the case of very large investors, on the markets themselves. For these investors, ‘Buy and Hold’ is the only option, so this is the message they preach in their marketing materials. Further, investors who can not sell do not invest in the development of market timing strategies.
Small investors who own stocks or mutual funds often deal with an Advisor with a large number of clients. Under regulations in Canada and the U.S., most Advisors must call each client for approval to buy or sell securities in their portfolios. An average Advisor with 200 clients to call may take a week or more to contact everybody. Often, these Advisors choose not to act rather than undertake the Herculean effort to reorient their clients’ accounts for changing market conditions. Further, market timing signals usually require quick action. As these Advisors can not act quickly to reallocate all their clients’ funds, they do not invest in the development of market timing systems.

Source: Butler|Philbrick & Associates
Click for larger version.


A small proportion of Advisors are licensed to make changes to all their clients’ portfolios at once without having to call. These Advisors usually have special qualifications, such as a CFA or a CIM, and significant experience such that regulators grant them permission to manage client portfolios with discretion. In Canada, professionals who service individual clients, and who possess a discretionary license, are designated Associate Portfolio Managers or Portfolio Managers. Often these Advisors manage small amounts of capital, usually less than $1 billion. Their discretionary license enables them to act quickly and decisively to protect or deploy their clients’ assets.
Associate Portfolio Managers and Portfolio Managers usually have the training, experience, and regulatory ability to take advantage of high quality market timing systems. However, very few invest the time and money to develop and test trading and timing systems that they can apply confidently to client portfolios. Perhaps they have misplaced faith in the Modern Portfolio Theory they learned in school. Perhaps they haven’t heard about Behavioral Economics, or tested the assumptions of MPT with real data.
Whatever the reason, this is unfortunate, as the payoff to those who take the time to research, develop and rigorously back-test trading and timing systems can be enormous.

Consider a simple timing system for a stock market index with a single signal line based purely on historical stock market index price data. If the market index closes above the signal line, an investor would purchase stocks. If the market index closes below the signal line, an investor would sell his stocks. The following chart illustrates this approach using the Dow Jones Industrial Average from 1966 through 1983. The stock market index is the blue line, and the signal line is red. If the blue line crosses below the red line, sell stocks. If the blue line crosses back above the red line, buy stocks.

Source: Butler|Philbrick & Associates
Click for larger version.

At certain levels of granularity (for example, using monthly closing data rather than daily or weekly), such a simple system yields significant results. By broadening the system to include more asset classes (i.e. commodities, foreign stocks, etc.), and simply allocating an equal portion of portfolios to each asset class, one is able to generate impressive results indeed.
The following chart illustrates a system that discretionary managers can easily apply to client accounts. Since 1973, this system has delivered substantially better results than stocks, and at a fraction of the market risk. The system’s worst year was 2008, with a 0.01% loss on the year. Further, the system has delivered positive returns in 92% of all 12-month periods.

Source: Faber (2009), Butler|Philbrick & Associates
Click for larger version.
A corollary myth in the market timing domain relates to the assertion by many buy-and-hold advocates that an investor must be in the market at all times to enjoy long-term growth. These misinformed ‘experts’ often cite statistics that show returns to a portfolio that was out of the market for the best 10-months out of the last 10, 25, 50, or 100 years. Obviously, the returns to a portfolio that missed the best 10  months of market returns will do substantially worse than a buy-and-hold investor. What the expert fails to mention is that the best months of returns in stocks usually follow or precede the worst months of returns in stocks. Further, these best and worst months usually occur during periods where a market timing model would have parked money in cash. In fact, over the past 138 years, 7 of the worst 10 months, and 8 of the best 10 months occurred during the Great Depression!
The following chart illustrates the returns to four portfolios. The blue line shows returns to a portfolio that managed to miss the 10 worst months. The red line shows returns to a portfolio that missed the 10 best months. The green line shows returns to a portfolio that missed both the best and the worst 10 months, while the purple line shows returns to a buy-and-hold investor.

Source: Butler|Philbrick & Associates
Click for larger version.
Observe that, quite obviously, investors who avoided big losses did better than investors that missed big gains. More interestingly, investors who avoided both large monthly gains and large monthly losses experienced approximately the same return over 138 years as an investor who held stocks from start to finish.
In conclusion, individual investors have an opportunity to commit the necessary time and effort to find a qualified, licensed portfolio manager who has invested in the development and testing of trading and timing systems to best protect and grow wealth. You are likely to pay more for the services of such a team, but the value you receive in return may deliver multiples of your costs.

Mythbusters: Investor Edition

It is prudent periodically to upset the apple cart in order to see what sort of rot and grime are sitting at the bottom. This series, which will include four or five posts over the next few days, will explore some common myths about investing and the investment industry.

The modern investment industry is highly motivated to conceal the realities that I intend to expose. The fat margins investment firms enjoy are predicated on the assumption that the professionals at these firms possess knowledge and information that is not available to the masses. This may be true in some cases, but large, traditional firms are handicapped in ways that more than offset this value.

The single most important take-away from this series is this: almost no one in the investment industry is motivated to take you out of the market when the risk is high. Because of this, almost no one in the investment industry is motivated to create systems and tools that signal when to get out.

Imagine for example that Fidelity, with $1.57 trillion of assets under managment, instructs their managers to pull their funds entirely out of the market. This would cause quite a dislocation. So what did they do? As necessity is the mother of invention, large money managers invented 'buy and hold'.

In this context, it makes sense to begin with a short primer on a a relatively new investment theory called ‘Behavioral Economics’ which is rapidly gaining in credibility, even among investment traditionalists. This theory addresses experimentally the many ways that Modern Portfolio Theory, the most widely adopted model in finance, fails to usefully describe reality.

An anecdote from the book SuperFreakonomics (2009) by Steven Levitt and Stephen Dubner illustrates the power of emotional biases to short-circuit rational behavior. The book describes an experiment orchestrated by Dr. Keith Chen where monkeys are conditioned to understand the utility of money as a way to acquire treats.

Once the monkeys learned they could trade a certain number of coins for different treats, the experimenters introduced ‘price shocks’ to test the monkeys’ rational adherence to the basic rules of supply and demand. When researchers ‘charged’ substantially more for one treat over another, monkeys bought less of the more ‘expensive’ treat and more of the less expensive. The demand curve slopes downward for monkeys as it does for humans.

To test for irrational behavior, the experimenters introduced two gambling games. This is where things really get interesting.

In the first game, a monkey was shown one grape and, depending on a coin toss, either received just the one grape, or a ‘bonus’ grape as well. In the second game, the monkey was presented with two grapes to start. When the coin was flipped against him, the researcher took away one grape and the monkey received the other.

Note that in both games the monkeys got the same number of grapes on average. However, in the first game the grape is framed as a potential gain, whereas in the second game it is framed as a potential loss.

How did the monkeys react? From the book:

“Once the monkeys figured out that the two-grape researcher sometimes withheld the second grape and that the one grape researcher sometimes added a bonus grape, the monkeys strongly preferred the one-grape researcher.

A rational monkey would not have cared, but these irrational monkeys suffered from what psychologists call loss aversion. They behaved as if the pain of losing a grape was greater than the pleasure of gaining one.

Up until now, the monkeys appeared to be as rational as humans in their use of money, but surely this last experiment showed the vast gulf that lay between monkey and man.

Or did it?

The fact is that similar experiments with human beings, investors, have found that people make the same kind of irrational decisions and at a nearly identical rate. The data generated by the capuchin monkeys, Chen says, make them statistically indistinguishable from most key market investors. So the parallels between human beings and these tiny-brained food/sex monkeys remain intact.”

Loss aversion is one of the central principles of behavioral economics. The behavioral literature is consistent in observing that people are about twice as sensitive to losses as they are to gains. Investors manifest this behavior by holding on to losing positions for far too long in order to defer realizing a loss. On the flip side, investors sell their winning positions too soon in order to avoid ‘losing’ their gains.

For evidence that you or your Advisor may be a slave to the loss aversion instinct, look no further than your portfolio. If there are many positions with large losses that have been on the books for several months or years, loss aversion is a likely culprit. Successful investors sell their losing trades quickly while letting their winning trades run.

Loss aversion is just one facet of a broader theory of investor behavior called ‘Prospect Theory’. Behavioral Economics is much broader still, and fills many of the dangerous gaps that are not adequately addressed by Modern Portfolio Theory. Some other important behavioral vulnerabilities are outlined in the diagram below

(click image for larger version).

Source: Butler|Philbrick & Associates

The next post in this series will deal with timing the market. It turns out that there are tried and true rules to distinguish between markets that are likely to trend higher and markets that are in jeopardy of steep drops and volatility. It is the development of, confidence in, and above all adherence to these rules that distinguish successful investors from their poorer peers.

Monday, December 21, 2009

Astrology, Voodoo, Tarot Cards and Economics

From a recent piece by Michael Hudson (h/t Leo Kolivakis), economist and author of ‘Trade, Development and Foreign Debt’:
Bad economic content starts with bad methodology. Ever since John Stuart Mill in the 1840s, economics has been described as a deductive discipline of axiomatic assumptions. Nobel Prize winners from Paul Samuelson to Bill Vickery have described the criterion for economic excellence to be the consistency of its assumptions, not their realism. Typical of this approach is Nobel Prizewinner Paul Samuelson's conclusion in his famous 1939 article on "The Gains from International Trade": 
'In pointing out the consequences of a set of abstract assumptions, one need not be committed unduly as to the relation between reality and these assumptions.'
This attitude did not deter him from drawing policy conclusions affecting the material world in which real people live. These conclusions are diametrically opposed to the empirically successful protectionism by which Britain, the United States and Germany rose to industrial supremacy.
Typical of this now widespread attitude is the textbook Microeconomics by William Vickery, winner of the 1997 Nobel Economics Prize:
Economic theory proper, indeed, is nothing more than a system of logical relations between certain sets of assumptions and the conclusions derived from them ...
'The validity of a theory proper does not depend on the correspondence or lack of it between the assumptions of the theory or its conclusions and observations in the real world. A theory as an internally consistent system is valid if the conclusions follow logically from its premises, and the fact that neither the premises nor the conclusions correspond to reality may show that the theory is not very useful, but does not invalidate it. In any pure theory, all propositions are essentially tautological, in the sense that the results are implicit in the assumptions made.'
Such disdain for empirical verification is not found in the physical sciences. Its popularity in the social sciences is sponsored by vested interests. There is always self-interest behind methodological madness.
That is because success requires heavy subsidies from special interests who benefit from an erroneous, misleading or deceptive economic logic. Why promote unrealistic abstractions, after all, if not to distract attention from reforms aimed at creating rules that oblige people actually to earn their income rather than simply extracting it from the rest of the economy?
Essentially, Michael is highlighting statements from some of the pioneers of modern economics in which they assert that the quality of an economic theory is independent of the theory’s ability to describe reality. Instead they suggest that economic theory is valid if it is supported by a series of logical constructs that begin with sound premises.

The economics profession has thus denounced its own usefulness, and relegated itself to the same epistemological bucket as astrology, voodoo and tarot card reading.

Hudson goes on to attribute the ubiquitous acceptance of modern ecnomics as sound 'science' to the special interests who stand to benefit from a perpetuation of the status quo.

Investors and policy-makers take note. Forewarned is forearmed.

Wednesday, December 9, 2009

Quantifying the Debt Drag


Most economists and analysts do a poor job of capturing the juxtaposition between normal cyclical recovery expectations and long-term headwinds from structural consumer over-indebtedness. Those who argue for a perpetuation of the consumer credit cycle that began post WWII and accelerated exponentially starting in 1982, with a steepening in 1994, must implicitly believe that household debt can grow to the sky.


If instead we acknowledge that households have accumulated new debt equal to 50% of rolling GDP since 1980 (chart below), thereby doubling aggregate household debt outstanding to ~102%, this implies a 2.4% p.a. boost to aggregate consumer spending over that time period. Assuming average consumer spending as a proportion of GDP was 65% over this horizon, this amounted to a boost of ~1.6% p.a. to U.S. GDP.


This analysis is upwardly biased by mortgage debt, which only flows through to GDP in the form of rents, new home construction and sales, and consumption funded by 2nd mortgages or home equity lines of credit. If we just take the increase in consumer credit (revolving and non-revolving) since 1980 (chart below), which has increased from 12.93% of GDP to 17.988% of GDP, our analysis yields a boost of 1.15% p.a. as a result of this new consumer debt. With consumer spending at 65% of GDP this would have resulted in a boost of 0.75% p.a. from unsecured lines of credit, credit card debt, and car loans alone.


It is difficult to know to what degree mortgages to purchase existing homes biased the first analysis higher, or to what degree not accounting for home equity lines of credit and second mortgages biased the second analysis lower. I think it is safe to say, however, that the annual boost to U.S. GDP from the expansion in consumer debt is between 1% and 1.25% per annum between 1980 and 2009.

Importantly, if consumer debt somehow remains constant at current nosebleed levels going forward, U.S. GDP will grow at a rate 1% - 1.25% below average growth rates since 1980. If however consumers pay-down debt at the same pace that they accumulated it from 1980 - 2008, GDP growth will drop by a further 1% - 1.25%. This would then shave a total of 2% - 2.5% from GDP growth potential, which puts likely growth rates for U.S. GDP between 1% and 2% p.a. for the foreseeable future, barring the creation of another consumer credit cycle.

Interestingly, Japanese GDP growth averaged 1.9% during its 'Lost Decade' from 1990 - 2000 after posting 10+ years of 3 - 4% growth leading up to the Nikkei's 1989 peak. Despite aggressive policies by the BOJ to bring rates to zero and a massive buildup in Japanese government debt to offset corporate and household balance sheet rebuilding, Japanese GDP was exceedingly volatile through the 1990s and share prices dropped by 65% over the decade. Of course, they are almost 75% below their 1989 peak today.

Given this anemic consumption scenario, and the Japanese template for a debt deflation scenario, investors should be asking to what degree the market is discounting a long period of slower economic growth. With consumers retrenching, boomers retiring, and government indebtedness likely to necessitate higher corporate and personal taxes in the future, is it likely that stock market valuations will continue to hold at 1980 - 2008 levels relative to the size of the economy? Or is it possible that they may revert to levels that dominated for most of the last century.

Chart: Ratio of U.S. Stock Market Capitalization to U.S. GDP
Source: Ned Davis Research

Tuesday, December 1, 2009

Hussman: We face two possible states of the world.

John Hussman manages the eponymous Hussman Funds. Hussman was among the few who both forecast the 2008/2009 credit crisis, and also had the fortitude to position his clients' defensively in advance. Returns this year have lagged global stocks, but Hussman is largely unrepentant. Like us, he lacks faith in the sustainability of the current rally, and rails against the unconstitutional actions of the Fed in supporting the bondholders of egregiously mismanaged banks.

Dr. Hussman writes a weekly column at his web site, which I strongly encourage everyone to read. This is his latest piece.
November 30, 2009
Reckless Myopia

John P. Hussman, Ph.D.
All rights reserved and actively enforced.

I was wrong.

Not about the implosion of the credit markets, which I urgently warned about in 2007 and early 2008. Not about the recession, which we shifted to anticipating in November 2007. Not about the plunge in the stock market, which erased the entire 2002-2007 market gain, which was no surprise. Not about the “ebb and flow” of short-term data, which I frequently noted could produce a powerful (though perhaps abruptly terminated) market advance even in the face of dangerous longer-term cross-currents. I expect not even about the “surprising” second wave of credit distress that we can expect as we move into 2010.

From a long-term perspective, my record is very comfortable. But clearly, I was wrong about the extent to which Wall Street would respond to the ebb-and-flow in the economic data – particularly the obvious and temporary lull in the mortgage reset schedule between March and November 2009 – and drive stocks to the point where they are not only overvalued again, but strikingly dependent on a sustained economic recovery and the achievement and maintenance of record profit margins in the years ahead.

I should have assumed that Wall Street's tendency toward reckless myopia – ingrained over the past decade – would return at the first sign of even temporary stability. The eagerness of investors to chase prevailing trends, and their unwillingness to concern themselves with predictable longer-term risks, drove a successive series of speculative advances and crashes during the past decade – the dot-com bubble, the tech bubble, the mortgage bubble, the private-equity bubble, and the commodities bubble.

And here we are again.

We face two possible states of the world. One is a world in which our economic problems are largely solved, profits are on the mend, and things will soon be back to normal, except for a lot of unemployed people whose fate is, let's face it, of no concern to Wall Street. The other is a world that has enjoyed a brief intermission prior to a terrific second act in which an even larger share of credit losses will be taken, and in which the range of policy choices will be more restricted because we've already issued more government liabilities than a banana republic, and will steeply debase our currency if we do it again. It is not at all clear that the recent data have removed any uncertainty as to which world we are in.

Taking the weighted average outcome for the two states of the world still produces a poor average return/risk tradeoff. Taking the weighted average investment position for the two states of the world is somewhat more constructive. As I noted several weeks ago, I have adapted our weightings accordingly. As a result, we have been trading around a modest positive net exposure, increasing it slightly on market weakness, and clipping it on strength, as is our discipline. Currently, the Strategic Growth Fund has a net exposure to market fluctuations of less than 10%, but enough “curvature” (through index options) that our exposure to market risk will automatically become more muted on market weakness and more positive on market advances, allowing us to buy weakness and sell strength without material concern about the (increasing) risk of a market collapse.

There is no chance, even in hindsight (“could have, would have, should have” stuff) that I would have responded to the existing evidence in recent months with more than a moderate exposure to market risk during some portion of the advance since March. But our year-to-date returns might now be into a second digit had I recognized that investors have learned utterly nothing from the bubbles and collapses of the past decade. That recognition might have encouraged a greater weight on trend-following measures versus fundamentals, valuations, price-volume sponsorship, and other factors.

Still, our stock selections continue to perform well relative to the market, our risks remain well-managed through a substantial (though not full) hedge, and our investment approach has nicely outperformed the S&P 500 over complete market cycles, with substantially less downside risk than a passive investment approach. We have implemented some modest changes to improve our potential to benefit from (even ill-advised) speculative runs, but we've done fine nonetheless, and we can sleep nights.

Whether or not I have focused too much on probable “second-wave” credit risks is something we will find out in the quarters ahead – my record of economic analysis is strong enough that a “miss” on that front would be an outlier. What I do think is that over the past decade, investors (including people who hold themselves out as investment professionals) have become far more susceptible to reckless myopia than I would have liked to believe. They have become speculators up to the point of disaster.

Frankly, I've come to believe that the markets are no longer reliable or sound discounting mechanisms. The repeated cycle of bubbles and predictable crashes over the recent decade makes that clear. Rather, investors appear to respond to emerging risks no more than about three months ahead of time. Worse, far too many analysts and strategists appear to discount the future only in the most pedestrian way, by taking year-ahead earnings estimates at face value, and mindlessly applying some arbitrary and historically inconsistent multiple to them.

This is utterly different from true discounting – which does not rely on multiples, but instead carefully traces out the likely path of future revenues, profit margins, cash flows and earnings over time, and explicitly discounts expected payouts and probable terminal values back at an appropriate rate of return. That's what we actually do here. Talking in terms of multiples can make the process easier to explain, and can be a reasonable approach to the market as a whole if earnings are normalized properly, but ultimately, an investment security is a claim to a long-term stream of cash flows. It is not simply a blind multiple to the latest analyst estimate.

Fortunately, the evidence suggests that the long-term returns to a careful discounting approach tend to be strong even if investors repeatedly behave in speculative and short-sighted ways. This is because long-term returns are fully determined by the stream of cash flows actually received by investors over time, and because inappropriate valuations ultimately tend to mean-revert. In the face of speculative noise, the long-term returns from a proper discounting approach may not capture as much speculative return as might be possible, but over time, many of those speculative swings tend to wash out anyway.

In part, the market's increasing propensity toward speculation reflects the increasing lack of fiscal and monetary discipline from our leaders. Policy makers who seek quick fixes and could care less about long-term consequences undoubtedly encourage investors to embrace the same value system. Paul Volcker was the last Fed Chairman to have any sense that discipline and the acceptance of temporary discomfort was good for the nation.

Our current Fed Chairman's voice literally quivers in response to the phrase “bank failure,” even though in the present context, a bank failure implies none of the disorganized outcomes that characterized the Great Depression. It simply means that the bondholders take a loss and the remaining part of the institution survives intact as a “whole bank” entity (and can be sold or re-issued back to public ownership, less the debt to bondholders, as such). The same outcome would have been possible with Lehman had the FDIC been granted authority from Congress to take conservatorship of a non-bank financial entity.

In my estimation, there is still close to an 80% probability (Bayes' Rule) that a second market plunge and economic downturn will unfold during the coming year. This is not certainty, but the evidence that we've observed in the equity market, labor market, and credit markets to-date is simply much more consistent with the recent advance being a component of a more drawn-out and painful deleveraging cycle. Meanwhile, valuations are clearly unfavorable here, and even under the “typical post-war recovery” scenario, we are observing an increasing number of internal divergences and non-confirmations in market action.

As Gluskin Sheff chief economist David Rosenberg noted last week, “Even if the recession is over, the historical record shows that downturns induced by asset deflation and credit contraction are different than a garden-variety recession induced by Fed tightening and excessive manufacturing inventories since the former typically induce a secular shift in behavior and attitudes towards debt, asset allocation, savings, discretionary spending and homeownership. The latter fades more quickly.

“This is why people didn't figure out that it was the Great Depression until two years after the worst point in the crisis in the 1930s; and why it took decades, not months, quarters or even years, for the complete transition to the next sustainable economic expansion and bull market.

“Mortgage applications for new home purchases hit a 12-year low in the middle of November (down 22% in the past month!), fully two weeks after the Administration said it was going to not only extend but expand the program to include higher-income trade-up buyers. Once again, there is minimal demand for autos and housing, and that is partly because the market is still saturated with both of these credit-sensitive big-ticket items after an unprecedented credit and consumer bubble that went absolutely parabolic in the seven years prior to the collapse in the financial markets an asset values. We are probably not even one-third of the way through this deleveraging cycle. Tread carefully.”

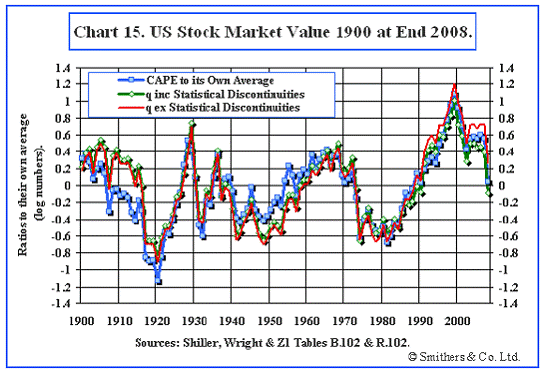
Andrew Smithers, one of the few other analysts who foresaw the credit implosion and remains a credible voice now, concurred last week in an interview with my friend Kate Welling (a former Barrons' editor now at Weeden & Company): “The good news so far is that the stock market got down to pretty much fair value or even, possibly, a tickle below it, at its March bottom. But now it has gone up… we probably have a market which is, roughly, 40% overpriced. In order to assess value, it is necessary either to calculate the level at which the EPS would be if profits were neither depressed nor elevated, or to use a metric of value which does not depend on profits. The cyclically adjusted P/E (CAPE) normalizes EPS by averaging them over 10 years. It thus follows the first of those two possible methods. Using even longer time periods has advantages, particularly as EPS have been exceptionally volatile in recent years - and using longer time periods raises the current measured degree of overvaluation. The other methodology we use measures stock market value without reference to profits: the q ratio. It compares the market capitalization of companies with their net worth, also adjusted to current prices. The validity of both of these approaches can be tested and is robust under testing - and they produce results that agree. Currently, both q and CAPE are saying that the U.S. stock market is about 40% overvalued.”

In the chart below, the current data point would be about 0.4, not as extreme as we observed in 1929, 2000, or 2007 of course, but equal to or beyond what we've observed at virtually every other market peak in history. This aligns well with our own analysis, where as I've noted in recent weeks, the S&P 500 is priced to deliver one of the weakest 10-year total returns in history except for the (ultimately disappointing) period since the mid-1990's.


One of the fascinating aspects of the past few months is the lack of equilibrium thinking with respect to what happened to the trillions of dollars in government money that has been spent to defend the bondholders of mismanaged financial companies. Almost by definition, money given to corporations will show up most quickly as improvements in corporate earnings, and then slightly later, as executive compensation. A few pieces came across my desk last week, hailing the ability of the corporate sector to bounce back from the recent economic downturn even though revenues have continued to suffer and employment has been steeply cut. Why is this a surprise? Where else could the money have gone? Labor compensation? It is truly mind-numbing that a moment after a temporary surge of trillions of dollars, borrowed and tossed out of a helicopter (though to specific corporations and private beneficiaries), analysts would hail a subsequent improvement in corporate results as evidence of “resilience.”

What matters is sustainability, and unfortunately, it is clear that credit continues to collapse. Banks are contracting their loan portfolios at a record rate, according to the latest FDIC Quarterly Banking Profile. Even so, new delinquencies continue to accelerate faster than loan loss reserves. Tier 1 capital looked quite good last quarter, as one would expect from the combination of a large new issuance of bank securities, combined with an easing of accounting rules to allow “substantial discretion” with respect to credit losses. The list of problem institutions is still rising exponentially. Overall, earnings and capital ratios have enjoyed a reprieve in the past couple of quarters, but delinquencies have not, and all evidence points to an acceleration as we move into 2010.

Urgent Policy Implications

From a policy standpoint, it is effectively too late to forestall further foreclosures absent explicit losses to creditors. The best policy option now is to make sure that the second wave does not result in a debasement of the U.S. dollar. The way to do that is to require three things:

First, the FDIC should be given regulatory authority to take non-bank financials into conservatorship the way they should have been able to do with Bear Stearns and Lehman. If this authority had existed in 2008, Bear's bondholders would not now stand to get 100% of their money back, with interest, as they presently do, and Lehman's disorganized liquidation would have been completely unnecessary. As I've noted before, the problem with Lehman was not that it went bankrupt, but that it went bankrupt in a disorganized way. If the FDIC had authority over insolvent non-bank financials and bank holding companies, it could wipe out equity and an appropriate amount of bondholder capital, and sell the fully-functioning residual to an acquirer, as is typically done with failing banks, without any loss to depositors or customers.

Second, bank capital requirements should be altered to require a substantial portion of bank debt to be of a form that automatically converts to equity in the event of capital inadequacy. This would force losses onto bondholders, rather than onto taxpayers. This policy adjustment is urgent – we have perhaps a few months to get this right.

Finally, Congress should be clear that government funds will be available only to protect the interests of depositors, not bondholders. Specifically, any funds provided by the government should be contingent on the ability to exert a senior claim to bondholders in the event of subsequent bankruptcy, even if a category is created to allow those funds to be counted as “capital” for purposes of satisfying capital requirements prior to such bankruptcy. Government-provided capital should be subordinate only to depositor claims, if equity and bondholder capital ultimately proves insufficient to meet those obligations.

Since early 2008, beginning with the provision of non-recourse funding in the Bear Stearns debacle, the Federal Reserve and the Treasury have repeatedly allocated or implicitly obligated public funds to defend the bondholders of mismanaged financial companies. This has included the outright and non-recourse purchase of nearly a trillion dollars in mortgage securities that have no explicit guarantee by the U.S. government. By purchasing these securities outright (rather than through a well-defined repurchase agreement), the Fed is effectively obligating the U.S. government to either guarantee them or to absorb any future losses.

Aside from the fraction of bailout funding that was specifically allocated by Congress through legislation, these actions represent an unconstitutional breach into enumerated spending powers that are the domain of the elected members of Congress alone. The issue here is not whether the Fed should be independent from political influence. The issue is the constitutionality of the Fed's actions. The discretion that it has exerted over the past two years crosses the line into prerogatives reserved for Congress. That line needs to be clarified sooner rather than later.

Emphatically, the trillions of dollars spent over the past year were not in the interest of protecting bank depositors or the general public. They went to protect bank bondholders. Instead of taking appropriate losses on those bonds (which financed reckless mortgage lending), those bonds are happily priced near their face value, for the benefit of private individuals, thanks to an equivalent issuance of U.S. Treasury debt. But that's not enough. Outside of a very narrow set of institutions that are subject to compensation limits, just watch how much of the public's money – which benefitted several major investment banks following a very direct route – gets allocated to Wall Street bonuses in the next few weeks.

Market Climate

As of last week, the Market Climate for stocks remained characterized by unfavorable valuations and mixed market action. The market remains significantly overbought on an intermediate-term basis, and we've seen increasing divergences from breadth, small and mid-cap stocks, trading volume, and other internals, which have lagged the most recent advance in the S&P 500 and other cap-weighted indices.

The prospect of a debt-repayment “standstill” from Dubai prompted some weakness in foreign markets that spilled over to the U.S. on Friday. This was interesting given that David Faber reported the issue on CNBC on Wednesday, to no reaction. Importantly, the payment difficulties do not stem from oil revenues, but largely from tourism and financial activity, as those are Dubai's chief industries (Dubai is home to the tallest building and the largest man-made islands in the world, for example). From that standpoint, it is difficult to imagine much in the way of contagion as a result of Dubai's difficulties.

Whatever shock the market will get from left field is likely to come from larger financial or geopolitical risks. The market for credit default swaps bears watching, but thus far we haven't observed spikes to indicate that something major is imminent. Unfortunately, as I noted earlier, investors have earned an “F” for vigilance in recent years, so our lead time on new difficulties may be shorter than we might like.

In any event, I'm pleased with the overall behavior of our stock holdings, and I expect that we'll have plenty of opportunity to increase our exposure to market fluctuations at more appropriate valuations. Presently, we've got a small amount of exposure to market fluctuations, but not enough to cause any material difficulties if the market experiences some trouble. The largest source of day-to-day fluctuations remains the difference in performance between the stocks we hold long and the indices we use to hedge. That source of risk has also been the primary contributor to returns over the life of the Fund.

In bonds, the Market Climate was characterized last week by moderately unfavorable yield levels and generally favorable yield pressures. We saw a good example of how the market is inclined to respond to fresh credit concerns last week, with upward pressure on the U.S. dollar and U.S. Treasuries, and downward pressure on foreign currencies and commodities. While I continue to believe that the dollar faces substantial risk of further erosion in its exchange value, as well as a near doubling of the CPI over the coming decade or so (both reflecting the massive increase in U.S. government liabilities in recent years), those prospects are not likely to emerge until risk-aversion about credit default materially abates. Credit concerns typically create a spike in demand for default-free assets such as U.S. government liabilities, so even though there is a much larger float than is likely to be sustained over time without inflation as the ultimate outcome, credit concerns tend to support the value of these liabilities and hence mutes immediate inflation pressures (essentially, monetary velocity declines as these liabilities are sought as a default-free store of value).

The Strategic Total Return Fund currently has an overall duration slightly over 3 years, primarily in straight Treasuries, with a small 1% exposure to precious metals shares and about 4% of assets in utility shares.

Links: Hussman Funds