Monday, December 21, 2009

Astrology, Voodoo, Tarot Cards and Economics

From a recent piece by Michael Hudson (h/t Leo Kolivakis), economist and author of ‘Trade, Development and Foreign Debt’:
Bad economic content starts with bad methodology. Ever since John Stuart Mill in the 1840s, economics has been described as a deductive discipline of axiomatic assumptions. Nobel Prize winners from Paul Samuelson to Bill Vickery have described the criterion for economic excellence to be the consistency of its assumptions, not their realism. Typical of this approach is Nobel Prizewinner Paul Samuelson's conclusion in his famous 1939 article on "The Gains from International Trade": 
'In pointing out the consequences of a set of abstract assumptions, one need not be committed unduly as to the relation between reality and these assumptions.'
This attitude did not deter him from drawing policy conclusions affecting the material world in which real people live. These conclusions are diametrically opposed to the empirically successful protectionism by which Britain, the United States and Germany rose to industrial supremacy.
Typical of this now widespread attitude is the textbook Microeconomics by William Vickery, winner of the 1997 Nobel Economics Prize:
Economic theory proper, indeed, is nothing more than a system of logical relations between certain sets of assumptions and the conclusions derived from them ...
'The validity of a theory proper does not depend on the correspondence or lack of it between the assumptions of the theory or its conclusions and observations in the real world. A theory as an internally consistent system is valid if the conclusions follow logically from its premises, and the fact that neither the premises nor the conclusions correspond to reality may show that the theory is not very useful, but does not invalidate it. In any pure theory, all propositions are essentially tautological, in the sense that the results are implicit in the assumptions made.'
Such disdain for empirical verification is not found in the physical sciences. Its popularity in the social sciences is sponsored by vested interests. There is always self-interest behind methodological madness.
That is because success requires heavy subsidies from special interests who benefit from an erroneous, misleading or deceptive economic logic. Why promote unrealistic abstractions, after all, if not to distract attention from reforms aimed at creating rules that oblige people actually to earn their income rather than simply extracting it from the rest of the economy?
Essentially, Michael is highlighting statements from some of the pioneers of modern economics in which they assert that the quality of an economic theory is independent of the theory’s ability to describe reality. Instead they suggest that economic theory is valid if it is supported by a series of logical constructs that begin with sound premises.

The economics profession has thus denounced its own usefulness, and relegated itself to the same epistemological bucket as astrology, voodoo and tarot card reading.

Hudson goes on to attribute the ubiquitous acceptance of modern ecnomics as sound 'science' to the special interests who stand to benefit from a perpetuation of the status quo.

Investors and policy-makers take note. Forewarned is forearmed.

Wednesday, December 9, 2009

Quantifying the Debt Drag


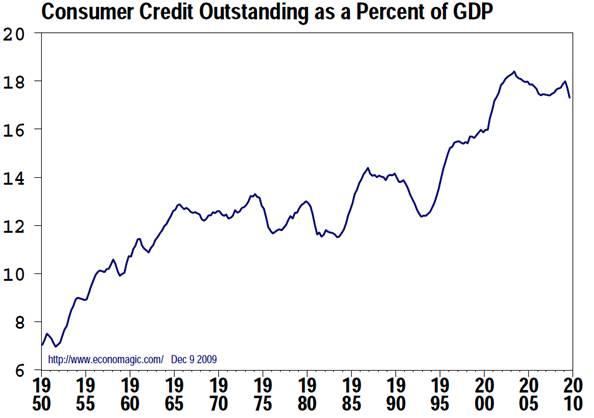
Most economists and analysts do a poor job of capturing the juxtaposition between normal cyclical recovery expectations and long-term headwinds from structural consumer over-indebtedness. Those who argue for a perpetuation of the consumer credit cycle that began post WWII and accelerated exponentially starting in 1982, with a steepening in 1994, must implicitly believe that household debt can grow to the sky.


If instead we acknowledge that households have accumulated new debt equal to 50% of rolling GDP since 1980 (chart below), thereby doubling aggregate household debt outstanding to ~102%, this implies a 2.4% p.a. boost to aggregate consumer spending over that time period. Assuming average consumer spending as a proportion of GDP was 65% over this horizon, this amounted to a boost of ~1.6% p.a. to U.S. GDP.


This analysis is upwardly biased by mortgage debt, which only flows through to GDP in the form of rents, new home construction and sales, and consumption funded by 2nd mortgages or home equity lines of credit. If we just take the increase in consumer credit (revolving and non-revolving) since 1980 (chart below), which has increased from 12.93% of GDP to 17.988% of GDP, our analysis yields a boost of 1.15% p.a. as a result of this new consumer debt. With consumer spending at 65% of GDP this would have resulted in a boost of 0.75% p.a. from unsecured lines of credit, credit card debt, and car loans alone.


It is difficult to know to what degree mortgages to purchase existing homes biased the first analysis higher, or to what degree not accounting for home equity lines of credit and second mortgages biased the second analysis lower. I think it is safe to say, however, that the annual boost to U.S. GDP from the expansion in consumer debt is between 1% and 1.25% per annum between 1980 and 2009.

Importantly, if consumer debt somehow remains constant at current nosebleed levels going forward, U.S. GDP will grow at a rate 1% - 1.25% below average growth rates since 1980. If however consumers pay-down debt at the same pace that they accumulated it from 1980 - 2008, GDP growth will drop by a further 1% - 1.25%. This would then shave a total of 2% - 2.5% from GDP growth potential, which puts likely growth rates for U.S. GDP between 1% and 2% p.a. for the foreseeable future, barring the creation of another consumer credit cycle.

Interestingly, Japanese GDP growth averaged 1.9% during its 'Lost Decade' from 1990 - 2000 after posting 10+ years of 3 - 4% growth leading up to the Nikkei's 1989 peak. Despite aggressive policies by the BOJ to bring rates to zero and a massive buildup in Japanese government debt to offset corporate and household balance sheet rebuilding, Japanese GDP was exceedingly volatile through the 1990s and share prices dropped by 65% over the decade. Of course, they are almost 75% below their 1989 peak today.

Given this anemic consumption scenario, and the Japanese template for a debt deflation scenario, investors should be asking to what degree the market is discounting a long period of slower economic growth. With consumers retrenching, boomers retiring, and government indebtedness likely to necessitate higher corporate and personal taxes in the future, is it likely that stock market valuations will continue to hold at 1980 - 2008 levels relative to the size of the economy? Or is it possible that they may revert to levels that dominated for most of the last century.

Chart: Ratio of U.S. Stock Market Capitalization to U.S. GDP
Source: Ned Davis Research

Tuesday, December 1, 2009

Hussman: We face two possible states of the world.

John Hussman manages the eponymous Hussman Funds. Hussman was among the few who both forecast the 2008/2009 credit crisis, and also had the fortitude to position his clients' defensively in advance. Returns this year have lagged global stocks, but Hussman is largely unrepentant. Like us, he lacks faith in the sustainability of the current rally, and rails against the unconstitutional actions of the Fed in supporting the bondholders of egregiously mismanaged banks.

Dr. Hussman writes a weekly column at his web site, which I strongly encourage everyone to read. This is his latest piece.
November 30, 2009
Reckless Myopia

John P. Hussman, Ph.D.
All rights reserved and actively enforced.

I was wrong.

Not about the implosion of the credit markets, which I urgently warned about in 2007 and early 2008. Not about the recession, which we shifted to anticipating in November 2007. Not about the plunge in the stock market, which erased the entire 2002-2007 market gain, which was no surprise. Not about the “ebb and flow” of short-term data, which I frequently noted could produce a powerful (though perhaps abruptly terminated) market advance even in the face of dangerous longer-term cross-currents. I expect not even about the “surprising” second wave of credit distress that we can expect as we move into 2010.

From a long-term perspective, my record is very comfortable. But clearly, I was wrong about the extent to which Wall Street would respond to the ebb-and-flow in the economic data – particularly the obvious and temporary lull in the mortgage reset schedule between March and November 2009 – and drive stocks to the point where they are not only overvalued again, but strikingly dependent on a sustained economic recovery and the achievement and maintenance of record profit margins in the years ahead.

I should have assumed that Wall Street's tendency toward reckless myopia – ingrained over the past decade – would return at the first sign of even temporary stability. The eagerness of investors to chase prevailing trends, and their unwillingness to concern themselves with predictable longer-term risks, drove a successive series of speculative advances and crashes during the past decade – the dot-com bubble, the tech bubble, the mortgage bubble, the private-equity bubble, and the commodities bubble.

And here we are again.

We face two possible states of the world. One is a world in which our economic problems are largely solved, profits are on the mend, and things will soon be back to normal, except for a lot of unemployed people whose fate is, let's face it, of no concern to Wall Street. The other is a world that has enjoyed a brief intermission prior to a terrific second act in which an even larger share of credit losses will be taken, and in which the range of policy choices will be more restricted because we've already issued more government liabilities than a banana republic, and will steeply debase our currency if we do it again. It is not at all clear that the recent data have removed any uncertainty as to which world we are in.

Taking the weighted average outcome for the two states of the world still produces a poor average return/risk tradeoff. Taking the weighted average investment position for the two states of the world is somewhat more constructive. As I noted several weeks ago, I have adapted our weightings accordingly. As a result, we have been trading around a modest positive net exposure, increasing it slightly on market weakness, and clipping it on strength, as is our discipline. Currently, the Strategic Growth Fund has a net exposure to market fluctuations of less than 10%, but enough “curvature” (through index options) that our exposure to market risk will automatically become more muted on market weakness and more positive on market advances, allowing us to buy weakness and sell strength without material concern about the (increasing) risk of a market collapse.

There is no chance, even in hindsight (“could have, would have, should have” stuff) that I would have responded to the existing evidence in recent months with more than a moderate exposure to market risk during some portion of the advance since March. But our year-to-date returns might now be into a second digit had I recognized that investors have learned utterly nothing from the bubbles and collapses of the past decade. That recognition might have encouraged a greater weight on trend-following measures versus fundamentals, valuations, price-volume sponsorship, and other factors.

Still, our stock selections continue to perform well relative to the market, our risks remain well-managed through a substantial (though not full) hedge, and our investment approach has nicely outperformed the S&P 500 over complete market cycles, with substantially less downside risk than a passive investment approach. We have implemented some modest changes to improve our potential to benefit from (even ill-advised) speculative runs, but we've done fine nonetheless, and we can sleep nights.

Whether or not I have focused too much on probable “second-wave” credit risks is something we will find out in the quarters ahead – my record of economic analysis is strong enough that a “miss” on that front would be an outlier. What I do think is that over the past decade, investors (including people who hold themselves out as investment professionals) have become far more susceptible to reckless myopia than I would have liked to believe. They have become speculators up to the point of disaster.

Frankly, I've come to believe that the markets are no longer reliable or sound discounting mechanisms. The repeated cycle of bubbles and predictable crashes over the recent decade makes that clear. Rather, investors appear to respond to emerging risks no more than about three months ahead of time. Worse, far too many analysts and strategists appear to discount the future only in the most pedestrian way, by taking year-ahead earnings estimates at face value, and mindlessly applying some arbitrary and historically inconsistent multiple to them.

This is utterly different from true discounting – which does not rely on multiples, but instead carefully traces out the likely path of future revenues, profit margins, cash flows and earnings over time, and explicitly discounts expected payouts and probable terminal values back at an appropriate rate of return. That's what we actually do here. Talking in terms of multiples can make the process easier to explain, and can be a reasonable approach to the market as a whole if earnings are normalized properly, but ultimately, an investment security is a claim to a long-term stream of cash flows. It is not simply a blind multiple to the latest analyst estimate.

Fortunately, the evidence suggests that the long-term returns to a careful discounting approach tend to be strong even if investors repeatedly behave in speculative and short-sighted ways. This is because long-term returns are fully determined by the stream of cash flows actually received by investors over time, and because inappropriate valuations ultimately tend to mean-revert. In the face of speculative noise, the long-term returns from a proper discounting approach may not capture as much speculative return as might be possible, but over time, many of those speculative swings tend to wash out anyway.

In part, the market's increasing propensity toward speculation reflects the increasing lack of fiscal and monetary discipline from our leaders. Policy makers who seek quick fixes and could care less about long-term consequences undoubtedly encourage investors to embrace the same value system. Paul Volcker was the last Fed Chairman to have any sense that discipline and the acceptance of temporary discomfort was good for the nation.

Our current Fed Chairman's voice literally quivers in response to the phrase “bank failure,” even though in the present context, a bank failure implies none of the disorganized outcomes that characterized the Great Depression. It simply means that the bondholders take a loss and the remaining part of the institution survives intact as a “whole bank” entity (and can be sold or re-issued back to public ownership, less the debt to bondholders, as such). The same outcome would have been possible with Lehman had the FDIC been granted authority from Congress to take conservatorship of a non-bank financial entity.

In my estimation, there is still close to an 80% probability (Bayes' Rule) that a second market plunge and economic downturn will unfold during the coming year. This is not certainty, but the evidence that we've observed in the equity market, labor market, and credit markets to-date is simply much more consistent with the recent advance being a component of a more drawn-out and painful deleveraging cycle. Meanwhile, valuations are clearly unfavorable here, and even under the “typical post-war recovery” scenario, we are observing an increasing number of internal divergences and non-confirmations in market action.

As Gluskin Sheff chief economist David Rosenberg noted last week, “Even if the recession is over, the historical record shows that downturns induced by asset deflation and credit contraction are different than a garden-variety recession induced by Fed tightening and excessive manufacturing inventories since the former typically induce a secular shift in behavior and attitudes towards debt, asset allocation, savings, discretionary spending and homeownership. The latter fades more quickly.

“This is why people didn't figure out that it was the Great Depression until two years after the worst point in the crisis in the 1930s; and why it took decades, not months, quarters or even years, for the complete transition to the next sustainable economic expansion and bull market.

“Mortgage applications for new home purchases hit a 12-year low in the middle of November (down 22% in the past month!), fully two weeks after the Administration said it was going to not only extend but expand the program to include higher-income trade-up buyers. Once again, there is minimal demand for autos and housing, and that is partly because the market is still saturated with both of these credit-sensitive big-ticket items after an unprecedented credit and consumer bubble that went absolutely parabolic in the seven years prior to the collapse in the financial markets an asset values. We are probably not even one-third of the way through this deleveraging cycle. Tread carefully.”

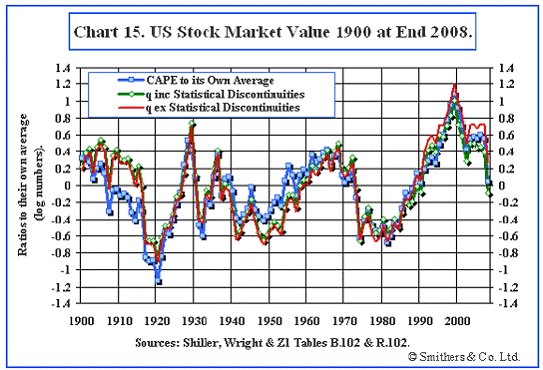
Andrew Smithers, one of the few other analysts who foresaw the credit implosion and remains a credible voice now, concurred last week in an interview with my friend Kate Welling (a former Barrons' editor now at Weeden & Company): “The good news so far is that the stock market got down to pretty much fair value or even, possibly, a tickle below it, at its March bottom. But now it has gone up… we probably have a market which is, roughly, 40% overpriced. In order to assess value, it is necessary either to calculate the level at which the EPS would be if profits were neither depressed nor elevated, or to use a metric of value which does not depend on profits. The cyclically adjusted P/E (CAPE) normalizes EPS by averaging them over 10 years. It thus follows the first of those two possible methods. Using even longer time periods has advantages, particularly as EPS have been exceptionally volatile in recent years - and using longer time periods raises the current measured degree of overvaluation. The other methodology we use measures stock market value without reference to profits: the q ratio. It compares the market capitalization of companies with their net worth, also adjusted to current prices. The validity of both of these approaches can be tested and is robust under testing - and they produce results that agree. Currently, both q and CAPE are saying that the U.S. stock market is about 40% overvalued.”

In the chart below, the current data point would be about 0.4, not as extreme as we observed in 1929, 2000, or 2007 of course, but equal to or beyond what we've observed at virtually every other market peak in history. This aligns well with our own analysis, where as I've noted in recent weeks, the S&P 500 is priced to deliver one of the weakest 10-year total returns in history except for the (ultimately disappointing) period since the mid-1990's.


One of the fascinating aspects of the past few months is the lack of equilibrium thinking with respect to what happened to the trillions of dollars in government money that has been spent to defend the bondholders of mismanaged financial companies. Almost by definition, money given to corporations will show up most quickly as improvements in corporate earnings, and then slightly later, as executive compensation. A few pieces came across my desk last week, hailing the ability of the corporate sector to bounce back from the recent economic downturn even though revenues have continued to suffer and employment has been steeply cut. Why is this a surprise? Where else could the money have gone? Labor compensation? It is truly mind-numbing that a moment after a temporary surge of trillions of dollars, borrowed and tossed out of a helicopter (though to specific corporations and private beneficiaries), analysts would hail a subsequent improvement in corporate results as evidence of “resilience.”

What matters is sustainability, and unfortunately, it is clear that credit continues to collapse. Banks are contracting their loan portfolios at a record rate, according to the latest FDIC Quarterly Banking Profile. Even so, new delinquencies continue to accelerate faster than loan loss reserves. Tier 1 capital looked quite good last quarter, as one would expect from the combination of a large new issuance of bank securities, combined with an easing of accounting rules to allow “substantial discretion” with respect to credit losses. The list of problem institutions is still rising exponentially. Overall, earnings and capital ratios have enjoyed a reprieve in the past couple of quarters, but delinquencies have not, and all evidence points to an acceleration as we move into 2010.

Urgent Policy Implications

From a policy standpoint, it is effectively too late to forestall further foreclosures absent explicit losses to creditors. The best policy option now is to make sure that the second wave does not result in a debasement of the U.S. dollar. The way to do that is to require three things:

First, the FDIC should be given regulatory authority to take non-bank financials into conservatorship the way they should have been able to do with Bear Stearns and Lehman. If this authority had existed in 2008, Bear's bondholders would not now stand to get 100% of their money back, with interest, as they presently do, and Lehman's disorganized liquidation would have been completely unnecessary. As I've noted before, the problem with Lehman was not that it went bankrupt, but that it went bankrupt in a disorganized way. If the FDIC had authority over insolvent non-bank financials and bank holding companies, it could wipe out equity and an appropriate amount of bondholder capital, and sell the fully-functioning residual to an acquirer, as is typically done with failing banks, without any loss to depositors or customers.

Second, bank capital requirements should be altered to require a substantial portion of bank debt to be of a form that automatically converts to equity in the event of capital inadequacy. This would force losses onto bondholders, rather than onto taxpayers. This policy adjustment is urgent – we have perhaps a few months to get this right.

Finally, Congress should be clear that government funds will be available only to protect the interests of depositors, not bondholders. Specifically, any funds provided by the government should be contingent on the ability to exert a senior claim to bondholders in the event of subsequent bankruptcy, even if a category is created to allow those funds to be counted as “capital” for purposes of satisfying capital requirements prior to such bankruptcy. Government-provided capital should be subordinate only to depositor claims, if equity and bondholder capital ultimately proves insufficient to meet those obligations.

Since early 2008, beginning with the provision of non-recourse funding in the Bear Stearns debacle, the Federal Reserve and the Treasury have repeatedly allocated or implicitly obligated public funds to defend the bondholders of mismanaged financial companies. This has included the outright and non-recourse purchase of nearly a trillion dollars in mortgage securities that have no explicit guarantee by the U.S. government. By purchasing these securities outright (rather than through a well-defined repurchase agreement), the Fed is effectively obligating the U.S. government to either guarantee them or to absorb any future losses.

Aside from the fraction of bailout funding that was specifically allocated by Congress through legislation, these actions represent an unconstitutional breach into enumerated spending powers that are the domain of the elected members of Congress alone. The issue here is not whether the Fed should be independent from political influence. The issue is the constitutionality of the Fed's actions. The discretion that it has exerted over the past two years crosses the line into prerogatives reserved for Congress. That line needs to be clarified sooner rather than later.

Emphatically, the trillions of dollars spent over the past year were not in the interest of protecting bank depositors or the general public. They went to protect bank bondholders. Instead of taking appropriate losses on those bonds (which financed reckless mortgage lending), those bonds are happily priced near their face value, for the benefit of private individuals, thanks to an equivalent issuance of U.S. Treasury debt. But that's not enough. Outside of a very narrow set of institutions that are subject to compensation limits, just watch how much of the public's money – which benefitted several major investment banks following a very direct route – gets allocated to Wall Street bonuses in the next few weeks.

Market Climate

As of last week, the Market Climate for stocks remained characterized by unfavorable valuations and mixed market action. The market remains significantly overbought on an intermediate-term basis, and we've seen increasing divergences from breadth, small and mid-cap stocks, trading volume, and other internals, which have lagged the most recent advance in the S&P 500 and other cap-weighted indices.

The prospect of a debt-repayment “standstill” from Dubai prompted some weakness in foreign markets that spilled over to the U.S. on Friday. This was interesting given that David Faber reported the issue on CNBC on Wednesday, to no reaction. Importantly, the payment difficulties do not stem from oil revenues, but largely from tourism and financial activity, as those are Dubai's chief industries (Dubai is home to the tallest building and the largest man-made islands in the world, for example). From that standpoint, it is difficult to imagine much in the way of contagion as a result of Dubai's difficulties.

Whatever shock the market will get from left field is likely to come from larger financial or geopolitical risks. The market for credit default swaps bears watching, but thus far we haven't observed spikes to indicate that something major is imminent. Unfortunately, as I noted earlier, investors have earned an “F” for vigilance in recent years, so our lead time on new difficulties may be shorter than we might like.

In any event, I'm pleased with the overall behavior of our stock holdings, and I expect that we'll have plenty of opportunity to increase our exposure to market fluctuations at more appropriate valuations. Presently, we've got a small amount of exposure to market fluctuations, but not enough to cause any material difficulties if the market experiences some trouble. The largest source of day-to-day fluctuations remains the difference in performance between the stocks we hold long and the indices we use to hedge. That source of risk has also been the primary contributor to returns over the life of the Fund.

In bonds, the Market Climate was characterized last week by moderately unfavorable yield levels and generally favorable yield pressures. We saw a good example of how the market is inclined to respond to fresh credit concerns last week, with upward pressure on the U.S. dollar and U.S. Treasuries, and downward pressure on foreign currencies and commodities. While I continue to believe that the dollar faces substantial risk of further erosion in its exchange value, as well as a near doubling of the CPI over the coming decade or so (both reflecting the massive increase in U.S. government liabilities in recent years), those prospects are not likely to emerge until risk-aversion about credit default materially abates. Credit concerns typically create a spike in demand for default-free assets such as U.S. government liabilities, so even though there is a much larger float than is likely to be sustained over time without inflation as the ultimate outcome, credit concerns tend to support the value of these liabilities and hence mutes immediate inflation pressures (essentially, monetary velocity declines as these liabilities are sought as a default-free store of value).

The Strategic Total Return Fund currently has an overall duration slightly over 3 years, primarily in straight Treasuries, with a small 1% exposure to precious metals shares and about 4% of assets in utility shares.

Links: Hussman Funds 

Friday, September 4, 2009

1930's Redux

David Rosenberg quoted from a September 1930 Wall Street Journal editorial in this morning's 'Breakfast with Dave'. With Spiritus Animus bubbling to the surface today, wise investors would be well served to keep things in perspective. The following piece should put even the most bullish data and comments in context:

August 28, 1930:

"There’s a large amount of money on the sidelines waiting for investment opportunities; this should be felt in market when “cheerful sentiment is more firmly entrenched.” Economists point out that banks and insurance companies “never before had so much money lying idle.”

September 3, 1930:

"Market has now reached [the] resistance level where it ran out of steam on July 18 (240.57) and July 28 (240.81). Breaking through this level would be considered a highly bullish signal. General confidence that this will happen based on recent market action; many leading stocks have already surpassed July highs. Further positive technicals seen in recent volume pattern (higher on rallies and lower on pullbacks), and in continued large short interest.

Some wariness based on recent good rally recovering all of drought-related break; some observers advise taking profits on at least part of long positions, to be in position to rebuy on good pullbacks.

Most economists agree business upturn is close; peak in business was reached July 1929, so depression has lasted about 14 months. “Those who have faith and confidence in the country and its ability to come back will profit by their foresight. This has also been the case over the past half century.”

Harvard Economic Society points to steady rise in bond prices as favorable for stocks. Says there is “every prospect that the [business] recovery ... will not long be delayed,” although fall period may not be strong as expected. Notes worldwide decline in business, but 1922 recovery demonstrates U.S. due to “great size, natural advantages, and diversity of conditions ... can lift itself out of depression without the stimulus of improved foreign demand.”

Rosenberg concludes with the ominous, "We only know now with perfect hindsight what these pundits did not know back then — that there was another 80% of downside left in the bear market."

Thursday, September 3, 2009

The Statistics of Prediction

Given the high level of ambiguity in the economy and markets at the moment (both gold and Treasuries rallying?), I thought it might be useful to revisit the concept of forecast error. Economic forecasters, even (perhaps especially?) the top, highest paid Wall Street celebrity economists, are egregiously poor predictors of stock market levels or direction over any meaningful time frame.

Robert Prechter does an excellent job of describing the logical fallacy about economists:

From Elliott Wave Theorist, May 2009

"Although it has suddenly become fashionable to bash economists, I would like to point out that economists are very valuable when they stick to economics. They can explain, for example, why and individual's pursuit of self interest is beneficial to others, why prices fall when technology improves, why competition breeds cooperation, why political action is harmful, and why fiat money is destructive. Such knowledge is crucial to the survival of economies.

Economic theory pertains to economics, but not to finance and so-called macro-economics. Socionomic theory pertains to social mood and its consequences, which manifest in the fields of finance and macro-economics.

If you want someone to explain why minimum wage laws hurt the poor, talk to an economist. But if you want someone to predict the path of the stock market, talk to a socionomist.

The two fields are utterly different, yet economists don't know it.

How Correct are Economists Who Forecast Macro-Economic Trends?

The Economy is usually in expansion mode. It contracts occasionally, sometimes mildly, sometimes severely. Economists generally stay bullish on the macro-economy. In most environments, this is an excellent career tactic. The economy expands most of the time, so economists can claim they are right, say, 80 percent of the time, while missing every turn toward recession and depression.

Now, suppose a market analyst actually has some ability to warn of downturns. He detects signs of a downturn ten times, catching all four recessions that actually occur but issuing false warnings six times. He, a statistician might say, is right only about 40 percent of the time, just half as much as most economists; therefore the economist is more valuable. But these statistics are only as good as the premises behind them.

Suppose you eat at an outdoor cafe daily, but it happens that on average once every 100 days a terrorist will drive by and shoot all the customers. The economist has no tools to predict these occurrences, so he simply 'stays bullish' and tells you to continue lunching there. He's right 99 percent of the time. He is wrong 1% of the time. In that one instance, you are dead.

But the market analyst has some useful tools. he can predict probabilistically when the terrorist will attack, but his tools involve substantial error, to the point that he will have to choose on average 11 days out of 100 on which you must be absent from the cafe in order to avoid the day on which the attack will occur. This analyst is therefore wrong 10% of the time, which is ten times the error rate of the economist. But you don't die.

How can the economist be mostly right yet worthless and the analyst be mostly wrong yet invaluable? The statistics are clear - aren't they?

The true statistics, the ones that matter, are utterly different from those quoted above. When one defines the task as keeping the customer alive, the economist is 0% successful, and the analyst is 100% successful.

When consequences really matter, difference in statistical inference can be a life and death issue. In the real world, business people need timely warnings, and realize that economists miss most downturns entirely. Would you rather suffer several false alarms, or would you rather get caught in expansion mode at the wrong time and go bankrupt?

Focus on irrelevant statistics is one reason why economists have been improperly revered, and some analysts have been unfairly pilloried, during long-term bull markets. But economists' latest miss was so harmful to their clients that their reputation for forecasting isn't surviving it."

The following table offers a stark example of forecaster fallibility. Every December, Barron's financial journal gathers the top analysts from Wall Street, names most investors are familiar with, and asks them to forecast the value of the S&P500 on December 31st of the following year. Granted, this is an impossible task; a probable range might be more reasonable. But more importantly, it is also useless because markets can travel an infinite variety of paths to get from A to B, and the paths are important to anyone with an active view on the markets. Regardless, these analysts were off by such a large factor that it can legitimately be claimed that they offer no predictive value, whatsoever.


Source: Bloomberg, Butler|Philbrick & Associates

Note that the average estimate of 1650 from these 12 Chief Economists was 82% above the actual closing value on December 31st.

A recent study by James Montier of Societe Generale suggests that stock strategists at Wall Street’s biggest banks -- including Citigroup Inc., MorganStanley and Goldman Sachs Group Inc. -- have failed to predict returns for the Standard & Poor’s 500 Index every year this decade except 2005. Their forecasts were w rong by an average of 18 percentage points, according to data compiled by Bloomberg.

There is a mountain of evidence supporting the view that economist forecasts are statistically no more accurate than random guesses around a long-term trend. Yet most, if not all, Advisors eagerly follow the views of their favorite economist closely, and generally adhere to their recommendations. What is the definition of 'deranged'? Repeating the same mistake over and over while expecting a different result.

Monday, August 31, 2009

Macro Indicator Summary

I am impressed with markets' resilience in the face of China's 6.7% sell-off overnight. Aside from Hong-Kong, global equity markets have shrugged-off the new Chinese bear market with a disinterested grunt. Here in Canada, banks are mostly higher on the day despite a 1.5% drop in the index, while the U.S. banking sector continues to consolidate sideways, off just 0.75% today.
4:30pm update: Volume was lower across the board, so institutions are sitting on their hands.

9:30pm update: After-hours volume pushed end-of-day numbers well above yesterday's levels, registering a 'distribution day'.

Note: Please click on any and all charts for a larger image.

The clear losers from the China sell-off are commodities, with oil down $3 to below $70, and copper off 12 cents at 2.83. Oil is at critical support from a trend-line going back to late April (see chart of DBO below), while copper has reversed off important resistance at the 61.8% Fibonacci retracement level of $3.00 (See copper Fibs below).

DBO Oil Fund ETF

Source: Stockcharts.com

Copper Market with Fibonacci Levels

Source: Stockcharts.com

Commodity currencies, like the CAD and AUD sold off substantially earlier in the day but have since rebounded, especially against the Yen. The CAD/USD found support from its 50 day moving average slightly below 90 in the morning, and is likely to test its multi-week trend-line (currently at ~89) before finding further direction.

Canadian Dollar ETF

Source: Stockcharts.com

Canadian Dollar ETF / Japanese Yen ETF Ratio

Souce: Stockcharts.com

We monitor the Asian Dollar Index for macroeconomic strength in that region. The index has been consolidating for several weeks in a pennant formation which is likely to break up or down in the next few days. Given the ADXY's strength in the face of China's panic sell-off overnight, an upside breakout is more likely. On an upward break-out, there is resistance at the previous high (~109) which, if broken, would signal further emerging market strength, led by Asia.

Asian Dollar Index

Source: Bloomberg
Bonds are confirming the bearish story in commodities, with long-term Treasuries rallying to resistance for the second time in 2 days.

20+ Year US Treasury Bond ETF

Source: Stockcharts.com

The 10-year TIPS breakeven rate, a measure of bond traders' future inflation expectations, is testing key support today, suggesting that traders are skeptical of current commodity strength.

10-Year TIPS Breakeven Rate

Source: Bloomberg

10-year yields have also been consolidating in a pennant formation; a break of 3.25% would indicate a major change in the trend of 10-year rates, at which point equity bulls would necessarily be put on the defensive.

10-Year US Bond Yield

Source: Bloomberg

Gold continues to consolidate in its intermediate-term pennant structure forming the right shoulder of what looks like a huge inverse head and shoulders formation. This structure suggests higher prices lie ahead. However, there are two clear resistance levels that must be breached before we can celebrate gold's new up-trend. Using the GLD ETF chart, the first resistance line sits at ~$94.25, with the longer-term line at ~$95.50. These are important levels to watch. A breach of the upper resistance line would suggest a re-test of the previous highs near $99, with potential for a test of it's all-time high of $100.44.

GLD US Gold ETF

Source: Stockcharts

Meanwhile, credit spreads seem impervious to the macro fragility implied by the charts above. CDS spreads in Europe and the U.S. continue to consolidate near their intermediate-term lows.

In conclusion, several important macro indicators are testing important resistance and support levels, but the pennant-shaped consolidation patterns suggest trend-continuation at this time. As such, stock markets are likely to move sideways in the short-term, with the potential for a short-term correction driven by commodity weakness. The most likely intermediate-term direction for stocks is up, with the potential for the S&P to move as high as 1200 before we begin wave 3 down. Should 980 be taken out on the S&P, we would look for a more immediate, steeper decline to ensue.

For longer-term context, I leave you with Doug Short's most recent chart of the Three Mega Bear Markets.


Source: Dshort.com

Sunday, August 23, 2009

The Fallacy of Cash on the Sidelines

Merrill Lynch posted the results of its most recent Survey of Fund Managers for August this morning. The survey covered 204 fund managers in 80 countries who control $554 billion in assets, and the data dispels the myth of excess cash on the sidelines.

Barry Ritholtz at ritholtz.com summarized the findings. Note that U.S. markets peaked in September 2007:

• Cash balances plunge to 3.5%, lowest since July'07;

• Highest equity allocation (34% from 7%) since Oct'07;

• Bond allocation (-28% from -12%) lowest since April'07;

• Tech (28%) is the most favored sector everywhere.

Barry concluded, 'While I keep hearing about cash on the sidelines, the professionals seem to be "All In."'

As an addendum to the Merrill Lynch survey (full release pasted below), please see the attached chart of US commercial paper and Money Market assets. The chart was originally posted by WallStreetExaminer.com using US Federal Reserve data. Annotations in red are my own.


Source: WallStreetExaminer.com
Click image for larger version

Conclusion: Investable Money Market fund assets are no higher than at the peak of markets in September 2007. Retail holdings of MM funds have now retraced to the levels of Sept 2007. The spike in Institutional MM assets from Sept 2007 is exactly equivalent to the drop in CP assets over the same time period, offering compelling evidence that companies have simply moved treasury working capital out of CP and into IMM funds. This is NOT parked investment capital, and is unlikely to find its way into stocks.

Investors appear to be exactly as fully invested as they were in September 2007, at the peak of the bull market. This dovetails nicely with the Merrill survey.

That said, the Primary Dealers are swimming in reserves. Liquidity parked in Securities Open Market Accounts at Primary Dealers is also back at September 2007 levels (See PD Liquidity Chart). If the money-centre banks decided to leverage these reserves into the system, they could single-handedly push stocks, commodities and corporate bonds higher. It remains to be seen whether banks will hold these as reserves against 'Level III' assets on their balance sheets or put it to work speculating.


Source: WallStreetExaminer.com
Click image for larger version

*************************************************************************
http://news.prnewswire.com/DisplayReleaseContent.aspx?ACCT=104&STORY=/www/story/08-19-2009/0005079889&EDATE=
NEW YORK, NY UNITED STATES

Questions over Imbalances in Early Stages of Recovery

NEW YORK and LONDON, Aug. 19 /PRNewswire/ -- Investor optimism about the global economy has soared to its highest level in nearly six years, with portfolio managers putting their cash back into equity markets, according to the Merrill Lynch Survey of Fund Managers for August.

A net 75 percent of survey respondents believe the world economy will strengthen in the coming 12 months, the highest reading since November 2003 and up from 63 percent in July. Confidence about corporate health is at its highest since January 2004. A net 70 percent of the panel respondents expect global corporate profits to rise in the coming year, up from 51 percent last month.

August's survey shows that investors are matching their sentiment with action, by putting cash to work. Average cash balances have fallen to 3.5 percent from 4.7 percent in July, their lowest level since July 2007. Equity allocations have risen sharply month-over-month with a net 34 percent of respondents overweight the asset class, up from a net 7 percent in July. Merrill Lynch's Risk and Liquidity Indicator, a measure of risk appetite, has risen to 41, the highest in two years.

"Strong optimism in August represents a big turnaround from the apocalyptic bearishness of March. And yet with four out of five investors predicting below trend growth for the year ahead, a nagging lack of conviction about the durability of the recovery remains," said Michael Hartnett, chief global equities strategist at Banc of America Securities-Merrill Lynch Research. "The equity rally has been narrowly led by China and tech stocks. We have yet to see investors fully embrace cyclical regions such as Japan or Europe, or Western bank stocks."

Lasting recovery requires greater balance

Global emerging markets, led by China, and technology stocks are the strongest engines behind the early recovery. Investors would rather be overweight emerging markets than any other region, and by some distance. A net 33 percent of the panel prefers to overweight emerging markets while investor consensus is to remain underweight the U.S., the eurozone, the U.K. and Japan.

Technology remains the number one sector, with 28 percent of the global panel overweight the industry. Industrials and Materials lag with global fund managers holding 11 percent and 12 percent overweight positions respectively.

Further behind are Banks. Global fund managers remain concerned about the sector, holding a 10 percent underweight position. In contrast, investors within emerging markets are positive about Banks with a net 17 percent of fund managers in the regional survey overweight bank stocks.

Some of these sectoral and regional imbalances are starting to erode, however. Global fund managers have scaled back their underweight positions in bank stocks from 20 percent in July. Industrials and Materials have recovered from underweight positions one month ago. Emerging markets are less popular than in July when 48 percent of the panel most wanted to overweight the region. And Europe is a lot less unpopular. In July, a net 30 percent of respondents wanted to underweight the eurozone. That figure has dropped to just 2 percent in August.

Improved outlook for Europe, but investors drag their feet

Within Europe, fund managers appear as excited about the outlook as their global colleagues. A net 66 percent of respondents to the regional survey expect the European economy to improve in the coming year, up from a net 34 percent in July.

The net percentage expecting earnings per share to rise nearly trebled, reaching 62 compared with a net 23 percent a month ago. Investors in the region took an overweight position in Basic Resources, a cyclical sector, and radically scaled back their overweight position in Pharmaceuticals, a defensive sector.

In contrast to global respondents, those in Europe have failed to inject new money. "European growth optimism has finally caught up with other regions, but fund managers have yet to fully act on this and cash levels have actually increased and overall sector conviction is near record lows," said Patrik Schowitz, European equity strategist at Banc of America Securities-Merrill Lynch Research.

Survey of Fund Managers

A total of 204 fund managers, managing a total of US$554 billion, participated in the global survey from 7 August to 12 August. A total of 177 managers, managing US$370 billion, participated in the regional surveys. The survey was conducted by Banc of America Securities - Merrill Lynch Research with the help of market research company TNS. Through its international network in more than 50 countries, TNS provides market information services in over 80 countries to national and multi-national organizations. It is ranked as the fourth-largest market information group in the world.
----------------------------------------------------

Saturday, August 22, 2009

Forever Blowing Bubbles

Those tortured souls who have thus far clung faithfully to the rules of capitalism, finance and economics they learned in business school have surely been disillusioned by the markets' most recent break to new highs. Like children who have finally relinquished the corporeal reality of Santa Claus, these poor souls may be searching for new rules and theories to legitimize their discipline. After all, we can't all be technical analysts, can we? Someone has to take the first step, buy the first shares in order to break a stock to new highs and trigger the technical feeding frenzy!

Those looking for new meaning in the markets may have already discovered the refreshing empiricism of behavioral economics to fill the theoretical void left from the now incontrovertible refutation of the efficient markets hypothesis and CAPM. Surely everyone now realizes that the only factors that impact asset prices are liquidity and sentiment. The former is measurable, though definitions vary considerably. Volume, cash on the sidelines, monetary growth and velocity, reserves held at Primary Dealers and foreign capital flows all contribute to a predictive measurement of liquidity. Sentiment is more esoteric, but can still be measured using surveys and studies of actual trader commitments. Of course, sentiment is only really predictive of market direction when it reaches extreme levels; extreme levels of bullish sentiment often signal important market tops (who is left on to buy more stock?), while extreme bearishness often signals market bottoms (who is left to sell stocks?).

James Montier of Societe Generale is perhaps the most widely followed practitioner of behavioral finance (as opposed to researchers and theorists like Thaler, Kahneman, Tversky and Smith). A recent missive of his was particularly interesting, as it described the results of a remarkable experiment in behavioral finance that may have some bearing on the present market environment.

From the report:

"As the US market is now back at fair value [950 at time of writing], I've been pondering what could drive the market higher. Jeremy Grantham provides some answers in his latest missive to clients. He argues that "the greatest monetary and fiscal stimulus by far in US history" coupled with a "super colossal dose of moral hazard" could generate a stock market rally "far in excess of anything justified by…economic fundamentals". This viewpoint receives support from the latest finding from experimental economics. The evidence from this field shows that even amongst the normally well behaved 'experienced' subjects, a very large liquidity shock can reignite a bubble!"

Mr. Montier then goes on to describe the results of an important study involving experimental markets (in which participants trade an equity-like asset against one another in a simulation), which suggests that experience helps to prevent bubbles - but that it takes more than one experience to change behavior. Explains Montier, "The first time people play the game, they create a massive bubble (like the dot.com bubble). The second time people play the game, they create yet another bubble. However, this seems to be driven by overconfidence that this time they will get out before the top. The third time subjects encounter the game, they generally end up with prices close to fundamental value."


To reiterate, experimental results indicate that even subjects who have experienced the euphoria and losses from the creation and eventual implosion of one market bubble will almost always go on to create another bubble under similar conditions. When surveyed after the fact to explain why they made the same mistake a second time, subjects overwhelmingly indicated that they were confident they could get out ahead of the crash. When subjects realized after their second failed attempt that they were unlikely to outsmart the bubble, they finally refused to create a bubble on their third encounter with the game.


Of particular interest in today's environment, the experimenters took the simulation one step further to discover whether, under the right conditions, they could cause the same experienced participants to create yet another bubble. It turns out that all it takes to re-ignite another bubble among experienced game participants is a massive liquidity injection. To wit, "new research by the godfather of experimental economics, Vernon Smith, shows that it is possible to reignite bubbles even amongst the normally staid and well behaved subjects who have played multiple bubble games. The key to this rekindling is massive liquidity creation. In fact, in his experiments Smith doubled the amount of liquidity available."

Why is this relevant to today's market situation? For starters, the Fed has essentially doubled the monetary base from $850 billion to $1.7 trillion in the past 12 months. Keep in mind that, given the leverage in the system ($~2 trillion in money supplied by the Fed supporting $56 trillion of credit), this has the potential to create a liquidity shock of epic proportions.


Source: FRB

However, given the stagnation in the growth of monetary aggregates (M2 and MZM), banks are not currently leveraging these new reserves. In fact, of the $850 billion added to the monetary base by the Fed, $733 billion has been re-deposited at the Fed by the money-centre banks rather than serving as reserves against new credit creation, suggesting that banks are not yet ready to initiate a new credit cycle. I have attached to charts to this email from the St. Louis Fed for illustrative purposes.


Source: FRB

In conclusion, the Fed and other central banks (notably the Bank of China) have certainly done everything in their power to create the elements necessary to catalyze another asset bubble powered by a new wave of credit creation by the money-centre banks. It remains to be seen whether markets will fall for the same trick a third time. Should the Fed succeed, and new bubbles form, investors would be wise to heed the lesson learned by participants in the market simulation cited above, and beware the trap of overconfidence. Not every investor can be quick enough to avoid the inevitable burst - are your tools up to the task?

Thursday, April 23, 2009

The Escherization of Bank Profits

Yep, even more bankster chicanery.

We knew that many of the banks have been taking advantage of the inscrutable fair value accounting rules by channelling reductions in the market values of their outstanding debt through income statements where they show up as earnings. If the value of outstanding liabilities declines while asset values are constant (under the revised fair value accounting rules introduced a few days ago), this can be recognized as an accounting gain.

This practice allows a bank to pad earnings on the basis that the risk implicit in its outstanding credit obligations has increased, likely due to the bank's deteriorating financial position. (All things equal, as interest rate spreads on a bond increase, the price of the bond (or debt) decreases). The mind-bending implication is that, should the bank's financial situation improve, spreads on its outstanding debt will narrow and the bank will have to book a loss.

Now we discover that, not only are the banks playing strange accounting games with the value of their outstanding liabilities, but many of the banks are actually booking profits from credit insurance written against their own debt! You just can't make this stuff up!

Apparently the CDSs are subject to fair value accounting even though they will ultimately mature with no value unless the company defaults on its own debt.

Don't worry if this didn't make any sense on first pass. It is the accounting equivalent of an M. C. Escher drawing.


Source: M.C. Escher via Wikipedia


******************************************************************
From Financial Times' Alphaville Blog:

Banking credit catch-22 in action?
Posted by Tracy Alloway on Apr 22 13:56.

On Monday we wrote about Citi's Q1 gains on credit value adjustments of its CDS.

We're still not sure whether this is an actual CDS position against itself. Citi's Q1statement has the following:

- A net $2.5 billion positive CVA on derivative positions, excluding monolines, mainly due to the widening of Citi's CDS spreads

- A net $30 million positive CVA of Citi's liabilities at fair value option

However, we do note this bit from Morgan Stanley's recently released Q1 results.

In fact, Morgan Stanley would have been profitable this quarter if not for the dramatic improvement in our credit spreads - which is a significant positive development, but had a near-term negative impact on our revenues.

There's a tiny bit more detail in the footnote of on the bank's $1.69bn of Q1 net revenue in Insitutional Securities.

(1) Results for the quarters ended Mar 31, 2008, Dec 31, 2008 and Mar 31, 2009 include positive / (negative) revenues of $1.8 billion, $(5.7) billion and $(1.5) billion, respectively, related to the movement in Morgan Stanley's credit spreads on certain long term debt.

The banking credit catch-22 in action? We wrote this on Monday in relation to Citi.

If the market thinks Citi is doing well, the bank's shares could rise, its CDS could tighten, its CVA gains could well reverse, hitting its earnings, and vice versa. If the market thinks it's doing badly, Citi's CVA gain will increase, but it could still possibly be in need of more capital.

Which today, turns into…

If the market thinks Morgan Stanley is doing well, the bank's shares could rise, its CDS could tighten, its CVA gains could well reverse, hitting its earnings…

This is something of a problem for financials and should serve to highlight the ephemeral nature of certain bank profits in general.

Holding to Account blogger Luca Pacioli (H/T reader JN) for instance, also points us in the direction of 2008 CVA gains from banks including Barclays, RBS, HSBC and Bank of America, totalling at least $13bn. In his words:

Together with Citi, that means approximately $17.9bn will have to be charged back to bank P&Ls. Or put another way - in the last few months, the above banks have reported $17.9bn of profit they probably will never actually realise (this is on top of the general MTM issues on illiquid assets).

Sunday, March 15, 2009

The Looting of America's Coffers

I am increasingly convinced that the looting of fiscal coffers by the international transactional class is one of the great defining issues of our time. I have observed this phenomenon with increasing frustration since the Bear Stearns intervention in early 2008. This type of looting is not new, of course.

We have become a society of looters. The transactional classes feel it is their noble right to perpetuate their status by looting the productive classes. This occurs in three ways:

1. The transfer of tax revenues to entities whose only productive effort is lobbying. This is nothing more than a form of graft and is the enemy of democratic society.

2. The incursion of sovereign debt, which is a tax on the productivity of future generations, in order to offset the natural loss in wealth of the current transactional classes as a result of capitalistic attrition. This looting occurs via 'bail-outs'. Whenever you hear the term 'bail-out' remember that this is a synonym for 'looting'.

3. The continuous creation of fiat money, which dilutes the purchasing power of savers via the hidden tax of inflation. The transactional classes protect themselves from this tax via the ownership of 'assets', the prices of which increase at a rate that exceeds the rate of inflation. It is the fear of asset price deflation that the transactional class fears most of all, and this fear is the motivation for looting.

Importantly, the transactional class is distinguished from the productive class in that the transactional class receives income from capital while the productive class receives income from productivity. Note that those who profit disproportionately from the productivity of others, such as a large fraction of corporate CEOs and other executives are also members of the transactional class, and are by definition 'looters'.

The recent announcement of $165 million in bonuses set aside for payment to executives of AIG provides the perfect example of a transfer of wealth from the productive class (taxpayers) to the transactional class (looters). AIG’s fourth-quarter loss of $61.7 billion was the biggest ever recorded for any U.S. company, and taxpayers are on the hook for several hundred billion dollars in 'bail-outs' to AIG.

**********************************************************************
The Looting of America’s Coffers

By DAVID LEONHARDT

Sixteen years ago, two economists published a research paper with a delightfully simple title: “Looting.”

The economists were George Akerlof, who would later win a Nobel Prize, and Paul Romer, the renowned expert on economic growth. In the paper, they argued that several financial crises in the 1980s, like the Texas real estate bust, had been the result of private investors taking advantage of the government. The investors had borrowed huge amounts of money, made big profits when times were good and then left the government holding the bag for their eventual (and predictable) losses.
In a word, the investors looted. Someone trying to make an honest profit, Professors Akerlof and Romer said, would have operated in a completely different manner. The investors displayed a “total disregard for even the most basic principles of lending,” failing to verify standard information about their borrowers or, in some cases, even to ask for that information.

The investors “acted as if future losses were somebody else’s problem,” the economists wrote. “They were right.”

On Tuesday morning in Washington, Ben Bernanke, the Federal Reserve chairman, gave a speech that read like a sad coda to the “Looting” paper. Because the government is unwilling to let big, interconnected financial firms fail — and because people at those firms knew it — they engaged in what Mr. Bernanke called “excessive risk-taking.” To prevent such problems in the future, he called for tougher regulation.

Now, it would have been nice if the Fed had shown some of this regulatory zeal before the worst financial crisis since the Great Depression. But that day has passed. So people are rightly starting to think about building a new, less vulnerable financial system.

And “Looting” provides a really useful framework. The paper’s message is that the promise of government bailouts isn’t merely one aspect of the problem. It is the core problem.

Promised bailouts mean that anyone lending money to Wall Street — ranging from small-time savers like you and me to the Chinese government — doesn’t have to worry about losing that money. The United States Treasury (which, in the end, is also you and me) will cover the losses. In fact, it has to cover the losses, to prevent a cascade of worldwide losses and panic that would make today’s crisis look tame.

But the knowledge among lenders that their money will ultimately be returned, no matter what, clearly brings a terrible downside. It keeps the lenders from asking tough questions about how their money is being used. Looters — savings and loans and Texas developers in the 1980s; the American International Group, Citigroup, Fannie Mae and the rest in this decade — can then act as if their future losses are indeed somebody else’s problem.

Do you remember the mea culpa that Alan Greenspan, Mr. Bernanke’s predecessor, delivered on Capitol Hill last fall? He said that he was “in a state of shocked disbelief” that “the self-interest” of Wall Street bankers hadn’t prevented this mess.

He shouldn’t have been. The looting theory explains why his laissez-faire theory didn’t hold up. The bankers were acting in their self-interest, after all.

The term that’s used to describe this general problem, of course, is moral hazard. When people are protected from the consequences of risky behavior, they behave in a pretty risky fashion. Bankers can make long-shot investments, knowing that they will keep the profits if they succeed, while the taxpayers will cover the losses.

This form of moral hazard — when profits are privatized and losses are socialized — certainly played a role in creating the current mess. But when I spoke with Mr. Romer on Tuesday, he was careful to make a distinction between classic moral hazard and looting. It’s an important distinction.

With moral hazard, bankers are making real wagers. If those wagers pay off, the government has no role in the transaction. With looting, the government’s involvement is crucial to the whole enterprise.

Think about the so-called liars’ loans from recent years: like those Texas real estate loans from the 1980s, they never had a chance of paying off. Sure, they would deliver big profits for a while, so long as the bubble kept inflating. But when they inevitably imploded, the losses would overwhelm the gains. As Gretchen Morgenson has reported, Merrill Lynch’s losses from the last two years wiped out its profits from the previous decade.

What happened? Banks borrowed money from lenders around the world. The bankers then kept a big chunk of that money for themselves, calling it “management fees” or “performance bonuses.” Once the investments were exposed as hopeless, the lenders — ordinary savers, foreign countries, other banks, you name it — were repaid with government bailouts.

In effect, the bankers had siphoned off this bailout money in advance, years before the government had spent it.

I understand this chain of events sounds a bit like a conspiracy. And in some cases, it surely was. Some A.I.G. employees, to take one example, had to have understood what their credit derivative division in London was doing. But more innocent optimism probably played a role, too. The human mind has a tremendous ability to rationalize, and the possibility of making millions of dollars invites some hard-core rationalization.

Either way, the bottom line is the same: given an incentive to loot, Wall Street did so. “If you think of the financial system as a whole,” Mr. Romer said, “it actually has an incentive to trigger the rare occasions in which tens or hundreds of billions of dollars come flowing out of the Treasury.”

Unfortunately, we can’t very well stop the flow of that money now. The bankers have already walked away with their profits (though many more of them deserve a subpoena to a Congressional hearing room). Allowing A.I.G. to collapse, out of spite, could cause a financial shock bigger than the one that followed the collapse of Lehman Brothers. Modern economies can’t function without credit, which means the financial system needs to be bailed out.

But the future also requires the kind of overhaul that Mr. Bernanke has begun to sketch out. Firms will have to be monitored much more seriously than they were during the Greenspan era. They can’t be allowed to shop around for the regulatory agency that least understands what they’re doing. The biggest Wall Street paydays should be held in escrow until it’s clear they weren’t based on fictional profits.

Above all, as Mr. Romer says, the federal government needs the power and the will to take over a firm as soon as its potential losses exceed its assets. Anything short of that is an invitation to loot.

Mr. Bernanke actually took a step in this direction on Tuesday. He said the government “needs improved tools to allow the orderly resolution of a systemically important nonbank financial firm.” In layman’s terms, he was asking for a clearer legal path to nationalization.

At a time like this, when trust in financial markets is so scant, it may be hard to imagine that looting will ever be a problem again. But it will be. If we don’t get rid of the incentive to loot, the only question is what form the next round of looting will take.

Mr. Akerlof and Mr. Romer finished writing their paper in the early 1990s, when the economy was still suffering a hangover from the excesses of the 1980s. But Mr. Akerlof told Mr. Romer — a skeptical Mr. Romer, as he acknowledged with a laugh on Tuesday — that the next candidate for looting already seemed to be taking shape.

It was an obscure little market called credit derivatives.